[pac_divi_table_of_contents included_headings="on|on|on|off|off|off" minimum_number_of_headings="6" scroll_speed="8500ms" level_markers_1="decimal" level_markers_3="none" title_container_bg_color="#004274" _builder_version="4.22.2" _module_preset="default"...

What is Ad Hoc Analysis and Reporting?
Table of Contents
2
3
We might face or hear such dialogues regularly in our work environment, today’s fast-paced business environment demands quick access and data analysing capabilities as a core business function. Standard transactions systems; standard ERP, CRM & Custom applications designed for specific business tasks do not have capabilities to analyse data on the fly to answer specific situational business questions.
Self-service BI tools can solve this need provided, it is a robust Data Warehouse composed of prower-full ETL from various data sources.
Here is the brief conversation, have a look:

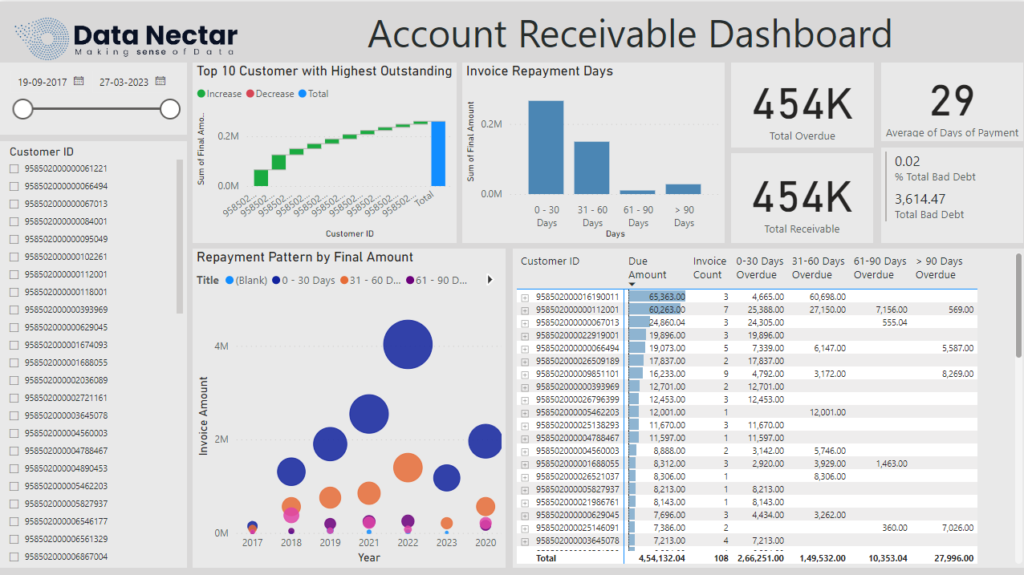
Senior Management: “Good morning, team. We have a meeting tomorrow evening with our leading customer, we urgently need some key numbers for their sales, Credit utilised, their top products and our profits on those products, and their payment patterns for this particular customer. These figures are crucial for our discussions, and we can’t afford any delays or inaccuracies. Unfortunately, our ERP system doesn’t cover these specific details in the standard dashboard.”
IT Team Lead: “Good morning. We understand the urgency, but without self-service BI tools, we’ll need time to extract, compile, and validate the data manually. Our current setup isn’t optimised for ad-hoc reporting, which adds to the challenge.”
Senior Management: “I understand the constraints, but we can’t afford another incident like last quarter. We made a decision based on incomplete data, and it cost us significantly. The board is already concerned about our data management capabilities.”
IT Team Member: “That’s noted. We’ll need at least 24 hours to gather and verify the data to ensure its accuracy. We’ll prioritise this task, but given our current resources, this is the best we can do.”
Senior Management: “We appreciate your efforts, but we need to avoid any future lapses. Let’s discuss a long-term solution post-meeting. For now, do whatever it takes to get these numbers ready before the board convenes. The credibility of our decisions depends on it.”
IT Team Lead: “Understood. We’ll start immediately and keep you updated on our progress. Expect regular updates as we compile the data.”
Senior Management: “Thank you. Let’s ensure we present accurate and comprehensive data to the board. Our decisions must be data-driven and error-free.”

Unlocking the Power of Self-Service BI for Ad Hoc Analysis
What is Ad-Hoc Analysis?
Process to create, modify and analyse data spontaneously to answer specific business questions is called Ad-Hoc Analysis also referred as Ad-Hoc reporting. Here to read carefully is “SPONTANEOUSLY”, e.g. as and when required, also may be from multiple sources.
In comparison to standard reports of ERP, CRM or other transactional system, those are predefined and static, Ad-Hoc analysis is dynamic and flexible and can be analyses on the fly.
Why is Ad-Hoc Analysis important to your business?
Data grows exponentially over the periods, Data Sources are also grown, Impromptu need of specific business questions can not be answered from a single data set, we may need to analyse data that are generated at different transactional systems, where in Ad-Hoc reporting or analysis is best fit option.
So, For the following reasons Ah-Hoc Analysis is important in the present business environment.
1. Speed and Agility:
Users can generate reports or insights in real time without waiting for IT or data specialists. This flexibility is crucial for making timely decisions and enables agile decision making.
2. Customization:
Every other day may bring unique needs, and standard reports may not cover all the required data points. Consider Ad-hoc analysis: every analysis is customised for their queries and reports to meet specific needs.
3. Improved Decision-Making:
Access to spontaneous data and the ability to analyse it from different angles lead to better-informed decisions. This reduces the risk of errors and enhances strategic planning.
You might not need full time Data Engineer, we have flexible engagement model to meet your needs which impact on ROI
Implementing Self-Service BI for Ad Hoc Analysis
Self-service BI tools empower non-technical users to perform data analysis independently.
What does your organisation need?
Curreated data from different sources to single cloud base data warehouse
With direct connections to a robust data warehouse, self-service BI provides up-to-date information, ensuring that your analysis is always based on the latest data.
Self Service BI tool which can visualise data. – Modern self-service BI tools feature intuitive interfaces that allow users to drag and drop data fields, create visualisations, and build reports without coding knowledge.
Proper training to actual consumers or utilizer of data for timely decision(they should not be waiting for the IT team to respond until their need requires highly technical support. Modern self-service BI tools feature intuitive interfaces that allow users to drag and drop data fields, create visualisations, and build reports without coding knowledge.

What will be impact one your organisation is ready with Self Service BI tools
Collaboration and Sharing:
Users can easily share their reports and insights with colleagues, fostering a culture of data-driven decision-making across the organisation.
Reduced IT Dependency:
By enabling users to handle their reporting needs, IT departments can focus on more strategic initiatives, enhancing overall efficiency.
Self Service Tools for Ad-Hoc Analysis
- Microsoft Excel
- Google Sheets
- Power BI
- Tableau
- Qlick
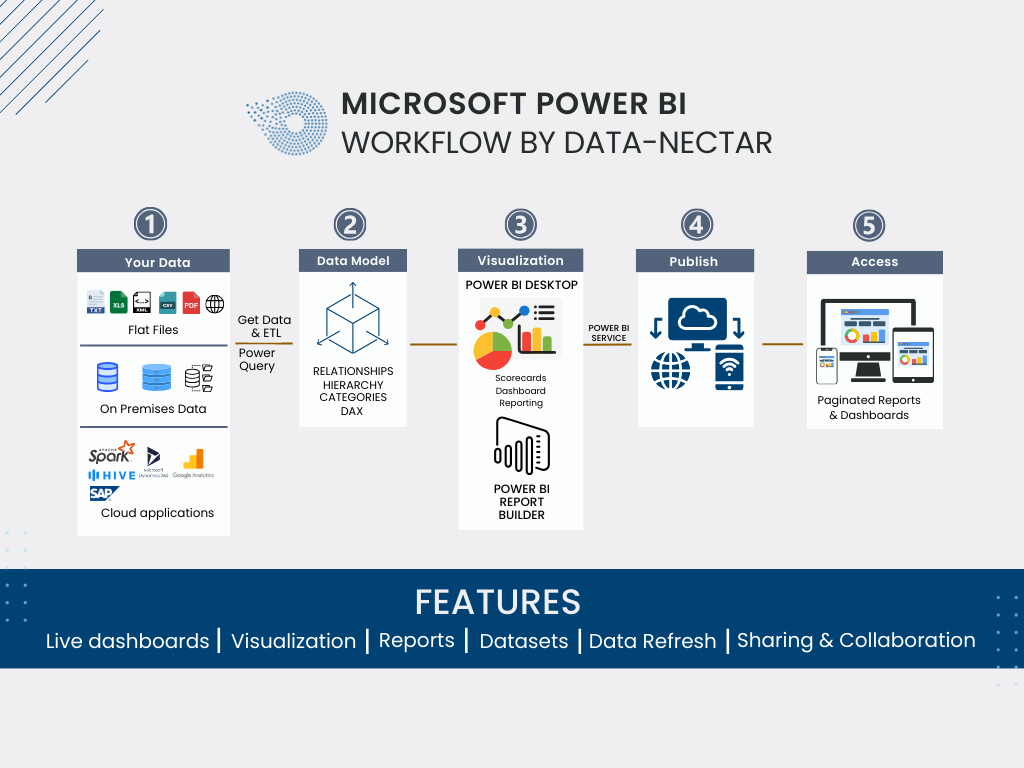
Read more about Getting Started with Power BI: Introduction and Key Features
How Data Nectar Can Help?
Data Nectar team have helped numerous organizations to implement end to end Self Service BI tools like Power BI, Tableau, Qlik, Google Data Studio or other, that includes Developing robust cloud or on premise data warehouse to be used at self service BI tools. Training on leading BI tools. Accelerate ongoing BI projects. Hire dedicated; full time or part time BI developer, migration from standard reporting practice to advance BI practice.
Final Wrapping,
Incorporating self-service BI tools for ad hoc analysis is a game-changer for any organisation. It bridges the gap between data availability and decision-making, ensuring that critical business questions are answered swiftly and accurately. By investing in self-service BI, companies can unlock the full potential of their data, driving growth and success in today’s competitive landscape.
Hire our qualified trainers who can train your non IT staff to use self service Business Intelligence tools.
Recent Post
Accelerate Data Workflows: Optimize Omnichannel sales with Delta Cache and Skipping
What is Ad Hoc Analysis and Reporting?
[pac_divi_table_of_contents included_headings="on|on|on|off|off|off" minimum_number_of_headings="6" scroll_speed="8500ms" level_markers_1="decimal" level_markers_3="none" title_container_bg_color="#004274" _builder_version="4.22.2" _module_preset="default"...

Top Benefits of Data Governance for Your Organization
[pac_divi_table_of_contents included_headings="on|on|on|off|off|off" minimum_number_of_headings="6" scroll_speed="8500ms" level_markers_1="decimal" level_markers_3="none" title_container_bg_color="#004274" admin_label="Table Of Contents Maker"...