[pac_divi_table_of_contents included_headings="on|on|on|off|off|off" minimum_number_of_headings="6" scroll_speed="8500ms" level_markers_1="decimal" level_markers_3="none" title_container_bg_color="#004274" _builder_version="4.22.2" _module_preset="default"...

Getting Started with Power BI: Introduction and Key Features
As You are here, congratulations on the first step toward a data-driven business journey. In today’s data-driven world, we all rely on data to make informed decisions in one way or another. Power BI was developed by Microsoft, a powerful business analytics service that empowers users to harness the potential of their data and transform it into actionable insights. In this comprehensive introduction to Power BI, we’ll explore what it is, its key features, why it matters, and real-world use cases.
What is Power BI?
At its core, Power BI is a versatile data analytics and data visualization tool. Users can connect to various data sources, transform raw data into meaningful insights, and create interactive business dashboards and paginated reports.
Key Features and core concepts to start with Power BI
To understand Power BI, it is necessary to understand the core elements of Power BI that encompass data analytics and reporting suites.
1. Creative Dashboard Design:
Power BI should be considered a self-service BI tool as it provides a wealth of data visualization options, using charts, cross-tab tables, maps, and more with great formatting functionalities for informative reports and dashboards. These dashboards can be printed or shared using Power BI services.
2. Smart Dataset Filtering
Using Power BI massive datasets can be filtered to zoom in on the stuff we want to refer to. It’s like focusing on specific data without drowning in the entire sea of information.
3. Data Connectivity
To analyze data, we first need the connectivity of different data sources. Power BI supports diverse data sources; including databases (SQL Server, Oracle), cloud services (Azure, AWS), online services (Google Analytics, Facebook), and local files (Excel, CSV).
4. Data Modeling
Once various data sources are connected to Power BI, the importance of data modeling can’t be overstated as it forms the foundation; establishing relationships between different data tables, and improving data quality and well-structured data contributes to better query performance.
5. Explore Data
Power BI’s drill-down functionality allows users to seamlessly explore data from high-level summaries down to granular transaction details. This hierarchical navigation provides transparency into the intricacies of the data, fostering a dynamic and interactive reporting experience. With customizable detail views, users can tailor their analyses, making Power BI a powerful tool for in-depth data exploration and insight generation.
6. Real-time Data
Power BI allows for real-time data analysis, ensuring that you’re always working with the most current information.
7. Power Query
Power Query is a built-in data transformation tool that enables you to shape and transform your data before analyzing it. It helps clean, filter, and format your data for optimal use.
8. The Statistical Language R
Power BI supports widely used Statistical Language R., Data Analytics is not just representing data in charts and table format. Statistical models can recognize patterns within datasets and can predict or forecast based on historical data. Statistical models also help in Hypothesis testing, risk management, decision support, segmentation & targeting, along machine learning.
You can refer link to Microsoft has comprehensive details about data sources supported by Power BI
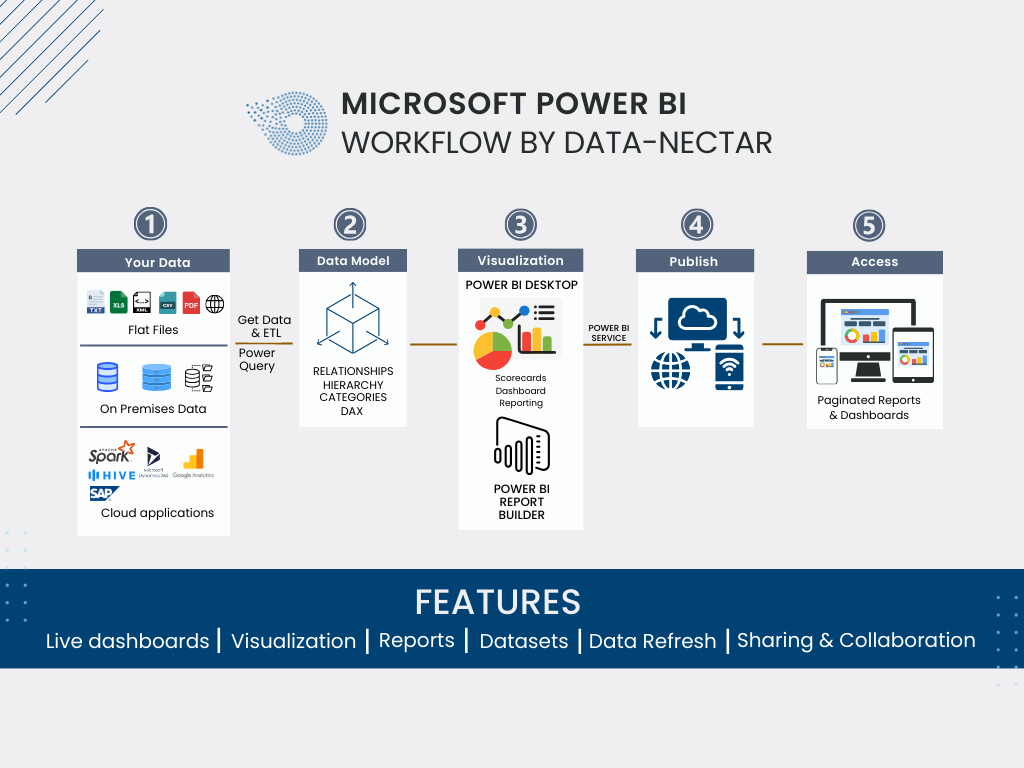
Above are core concepts to start with Power BI, though Power BI is distributed among the following platforms,
- Power BI Desktop – A free desktop application for Dashboard and Reports creation.
- Power BI Service – Microsoft-owned cloud platform to collaborate & distribute visualization/dashboards and reports.
- Power BI Mobile – We need data at our fingertips, thus Power BI mobile is a mobile application that allows us to interact with reports and dashboards over mobile devices and tablets.
- Power BI Report Builder – Power BI Report Builder is the modern successor to SSRS and it is part of the Power BI suite with enhanced capabilities to build paginated reports, effectively integrating traditional reporting functionality with the broader Power BI platform. Power BI Reports can be easily embedded into your custom web applications since Power BI provides a simple-to-implement framework.
- Power BI Report Server – On-premises report server to distribute reports, it is available through a Power BI Premium license.
For a better basic understanding of Power BI, refer to the following basic FAQs related to Power BI.
1) How do I download and install Power BI Desktop?
To download and install Power BI Desktop, visit the official Microsoft Power BI website, click on the “Download free” button, run the downloaded installer, and follow the on-screen instructions to complete the installation on your Windows machine.
2) What are the system requirements for Power BI Desktop?
Power BI Desktop requires a 64-bit version of Windows 7 or later, at least 1 GB RAM (2 GB recommended), and a display with a resolution of 1024×768 or higher. It’s compatible with x86 or x64 processors.
3) Is Power BI available for Mac?
Presently, Power BI Desktop is exclusively supported on Windows and isn’t directly installable on Mac systems. To use Power BI Desktop on your Mac, you may explore options such as running it on a virtual machine or utilizing a cloud service.
4) How can I create a Power BI account?
To create a Power BI account, go to the official Power BI website, click on “Sign up free,” provide your email address, follow the registration steps, and create a password. You’ll then have access to Power BI service and can start building and sharing reports.
5) What is the difference between Power BI Desktop and Power BI Service?
Power BI Desktop is a standalone application for creating reports and visualizations on a local machine, while Power BI Service is a cloud-based platform for sharing, collaborating, and publishing reports online. The desktop is used for report development, and the Service is used for hosting and sharing those reports in a collaborative online environment.
6) Can I use Power BI without an internet connection?
Yes, you can use Power BI Desktop without an internet connection for creating and modifying reports locally on your machine. However, to share, publish, and collaborate on reports, you’ll need an internet connection to utilize Power BI Service, which is cloud-based.
7) How do I get data into Power BI?
In Power BI, you can get data by clicking on “Get Data” in Power BI Desktop, selecting a data source (such as Excel, SQL Server, or online services), connecting to it, and importing or transforming the data as needed. Power BI supports a wide range of data sources for analysis and visualization.
8) What data sources does Power BI support?
Power BI supports various data sources, including Excel, SQL Server, Azure services, SharePoint, online services (such as Google Analytics and Salesforce), and many others. It also allows connections to on-premises data sources and supports a wide range of file formats.
9) Can I connect to on-premises data sources with Power BI?
Yes, Power BI enables connections to on-premises data sources using methods like DirectQuery or importing data. You can connect to on-premises databases, servers, and other sources to analyze and visualize the data within Power BI.
10) Is there a mobile app for Power BI?
Yes, there is a mobile app for Power BI available for both iOS and Android devices. You can download it from the respective app stores to access and interact with your Power BI reports and dashboards on the go.
11) What is Power BI Pro and Power BI Premium?
Power BI Pro is a subscription plan that allows individual users to collaborate, share, and consume content created in Power BI. Power BI Premium, on the other hand, is a capacity-based licensing model designed for larger organizations with heavier workloads. It offers dedicated resources, enhanced performance, and the ability to share reports with free Power BI users.
To share reports and dashboards in Power BI, you can publish them to the Power BI service, create a dashboard, and then share it with specific users or groups. For advanced collaboration, you may need Power BI Pro or Power BI Premium subscriptions, depending on your organization’s needs.
13) Can I embed Power BI reports in other applications?
Yes, you can embed Power BI reports in other applications using the Power BI Embedded service or leveraging the Power BI REST API. This allows you to integrate Power BI reports seamlessly into custom applications or websites.
Recent Post
Accelerate Data Workflows: Optimize Omnichannel sales with Delta Cache and Skipping
What is Ad Hoc Analysis and Reporting?
[pac_divi_table_of_contents included_headings="on|on|on|off|off|off" minimum_number_of_headings="6" scroll_speed="8500ms" level_markers_1="decimal" level_markers_3="none" title_container_bg_color="#004274" _builder_version="4.22.2" _module_preset="default"...
Top Benefits of Data Governance for Your Organization
[pac_divi_table_of_contents included_headings="on|on|on|off|off|off" minimum_number_of_headings="6" scroll_speed="8500ms" level_markers_1="decimal" level_markers_3="none" title_container_bg_color="#004274" admin_label="Table Of Contents Maker"...

