Accelerate Data Workflows: Optimize Omnichannel sales with Delta Cache and Skipping

Accelerate Data Workflows: Optimize Omnichannel sales with Delta Cache and Skipping

Databricks’ Delta Cache and Data Skipping are powerful features that can enhance the performance of data operations, especially for use cases like omnichannel sales operations, where large amounts of transactional and analytical data need to be processed efficiently.

Use Case: Omnichannel Sales Operations

Omnichannel sales involve integrating data from various channels (e.g., online stores, physical stores, mobile apps, and customer support) to provide a seamless customer experience. This requires real-time or near-real-time data processing to:

  1. Track inventory across channels.
  2. Optimize pricing strategies.
  3. Personalize customer experiences.
  4. Analyze sales performance across channels.

Challenges in Omnichannel Sales Data:

  • Huge data volume (sales transactions, inventory updates, customer interactions).
  • Query performance bottlenecks due to complex joins and aggregations.
  • Need for quick access to frequently queried data.

How Delta Cache and Data Skipping Help

  1. Delta Cache

What it is: Delta Cache automatically caches the most frequently accessed data in memory on the worker nodes of your Databricks cluster.

Benefits:

    • Speeds up repetitive queries by avoiding disk I/O.
    • Reduces cluster resource consumption.
    • Ideal for frequently queried data like customer purchase histories or inventory levels.
  1. Data Skipping

 What it is: Data Skipping reduces the amount of data scanned by leveraging metadata to skip irrelevant data during query execution.

Benefits:

    • Optimizes query performance by scanning only the necessary data blocks.
    • Particularly useful for large tables with partitioned data (e.g., sales data partitioned by date or region).
    • Enhances analytical queries like sales trend analysis for a specific time range or product category.

Need an expert to implement these solutions? Hire a developer today and optimise your data workflows!

Implementation for Omnichannel Sales Operations

Example Use Case: Sales Trend Analysis

Analyze sales trends for a specific product category across multiple regions and time periods.

Data Structure:

  • Table: sales_data
  • Partitions: region, category, date

Code Example with Delta Cache and Data Skipping

from pyspark.sql import SparkSession

# Initialize Spark session

  spark = SparkSession.builder.appName(“Delta Cache Example”).getOrCreate()

# Load Delta table

  sales_data = spark.read.format(“delta”).load(“/mnt/sales_data”)

# Enable Delta Cache for the table

  sales_data.cache()  # This caches the data in memory for faster access

# Example query: Analyze sales trends for a specific product category

  product_category = “Electronics”

  sales_trends = sales_data.filter(

        (sales_data[“category”] == product_category) &

        (sales_data[“date”] >= “2024-01-01”) &

        (sales_data[“date”] <= “2024-06-30”)

  ).groupBy(“region”).sum(“sales_amount”)

sales_trends.show()

Optimizing with Data Skipping

To optimize for Data Skipping, ensure the data is partitioned correctly.

# Writing data with partitions for skipping

  sales_data.write.format(“delta”).mode(“overwrite”).partitionBy(“region”, “category”, “date”).save(“/mnt/sales_data_partitioned”)

# Query the partitioned data

  partitioned_data = spark.read.format(“delta”).load(“/mnt/sales_data_partitioned”)

# Skipping irrelevant partitions automatically

  regional_sales = partitioned_data.filter(

       (partitioned_data[“region”] == “North America”) &

       (partitioned_data[“category”] == “Electronics”)

  ).select(“date”, “sales_amount”)

  regional_sales.show()

Important Tips

  1. Partition Strategically:
    • Use relevant dimensions like region, category, or date to minimize the data scanned during queries.
  2. Enable Auto-Optimize:
    • Use Delta Lake’s Auto Optimize to maintain efficient file layouts and indexing.
  3. SET spark.databricks.delta.optimizeWrite.enabled = true;
  4. SET spark.databricks.delta.autoCompact.enabled = true;
  5. Monitor and Tune Cache:
    • Use Databricks monitoring tools to ensure the Delta Cache is used effectively. Cache frequently queried data only.
  6. Leverage Z-Order Clustering:
    • For queries that involve multiple columns, Z-Order clustering can further improve Data Skipping performance.
  7. sales_data.write.format(“delta”).option(“zorder”, “region, date”).save(“/mnt/sales_data”)

Benefits in Omnichannel Sales Operations

  • Faster Queries: Reduced latency for reports and dashboards.
  • Cost Efficiency: Optimized cluster resource usage.
  • Scalability: Handles growing data volumes with efficient partitioning and caching.

By combining Delta Cache and Data Skipping with best practices, you can achieve real-time insights and a seamless omnichannel sales strategy.

Achieving the similar functionality in Snowflake provides similar functionalities to Databricks’ Delta Cache and Data Skipping, although implemented differently. Here’s how these functionalities map to Snowflake and a comparison:

Snowflake Functionalities

  1. Caching Mechanism in Snowflake:
    • Snowflake automatically caches query results and table metadata in its Result Cache and Metadata Cache.
    • While not identical to Databricks’ Delta Cache, Snowflake’s Result Cache accelerates queries by serving previously executed results without re-execution, provided the underlying data has not changed.
  2. Data Skipping in Snowflake:
    • Snowflake uses Micro-Partition Pruning, an efficient mechanism to skip scanning unnecessary micro-partitions based on query predicates.
    • This is conceptually similar to Data Skipping in Databricks, leveraging metadata to read only the required micro-partitions for a query.

Comparison: Delta Cache vs. Snowflake Caching

Feature Databricks (Delta Cache) Snowflake (Result/Metadata Cache)
Scope Caches data blocks on worker nodes for active jobs. Caches query results and metadata at the compute and storage layer.
Use Case Accelerates repeated queries on frequently accessed datasets. Reuses results of previously executed queries (immutable datasets).
Cluster Dependency Specific to cluster; invalidated when cluster is restarted. Independent of clusters; cache persists until the underlying data changes.
Control Manually enabled with .cache() or Spark UI. Fully automated; no user intervention required.

Comparison: Data Skipping vs. Micro-Partition Pruning

Feature Databricks (Data Skipping) Snowflake (Micro-Partition Pruning)
Granularity Operates at the file/block level based on Delta Lake metadata. Operates at the micro-partition level (small chunks of columnar data).
Partitioning Requires explicit partitioning (e.g., by date, region). Automatically partitions data into micro-partitions; no manual setup needed.
Optimization Users must manage partitioning and file compaction. Fully automatic pruning based on query predicates.
Performance Impact Depends on user-defined partitioning strategy. Consistently fast with Snowflake’s automatic optimizations.

How Snowflake Achieves This for Omnichannel Sales Operations

Scenario: Sales Trend Analysis

Data Structure:

  • Table: SALES_DATA
  • Micro-partitioning: Automatically handled by Snowflake.

Code Example in Snowflake

  1. Querying Data with Micro-Partition Pruning:
    • Snowflake automatically prunes irrelevant data using query predicates.

— Query sales trends for a specific category and time range

   SELECT REGION, SUM(SALES_AMOUNT) AS TOTAL_SALES

   FROM SALES_DATA

   WHERE CATEGORY = ‘Electronics’

   AND SALE_DATE BETWEEN ‘2024-01-01’ AND ‘2024-06-30’

  GROUP BY REGION;

    1. Performance Features:
      • Micro-Partition Pruning ensures that only relevant partitions are scanned.
      • Result Cache stores the output of the above query for future identical queries.

    Optimization Tips in Snowflake

    1. Clustering:
      • Use Cluster Keys to optimize data for frequently used columns like CATEGORY and SALE_DATE.
    2. ALTER TABLE SALES_DATA CLUSTER BY (CATEGORY, SALE_DATE);
    3. Materialized Views:
      • Create materialized views for frequently accessed aggregations.
    4. CREATE MATERIALIZED VIEW SALES_TRENDS AS
    5. SELECT REGION, SUM(SALES_AMOUNT) AS TOTAL_SALES
    6. FROM SALES_DATA
    7. GROUP BY REGION;
    8. Query History:
      • Use Snowflake’s Query Profile to analyze performance and identify bottlenecks.

    Key Differences for Omnichannel Sales Operations

    Aspect

    Databricks

    Snowflake

    Setup Complexity

    Requires manual partitioning and caching.

    Fully automated; minimal user intervention.

    Real-Time Performance

    Faster for frequently queried data when cached.

    Fast out-of-the-box with automatic caching and pruning.

    Scalability

    Scales with Spark clusters.

    Scales seamlessly with Snowflake’s architecture.

    Use Case Suitability

    Better for iterative big data processing.

    Better for ad-hoc analytics and structured queries.

    Conclusion

    • Choose Databricks if your omnichannel sales operations require complex transformations, real-time streaming, or iterative data processing.
    • Choose Snowflake if you prioritize ease of use, ad-hoc query performance, and automated optimizations for structured analytics.

    Both platforms are powerful; the choice depends on your operational needs and the complexity of your data workflows.

    Looking to bring these strategies to life? Hire a skilled developer to integrate Delta Cache and Data Skipping into your operations.

    Recent Post

    What is Ad Hoc Analysis and Reporting?
    What is Ad Hoc Analysis and Reporting?

    [pac_divi_table_of_contents included_headings="on|on|on|off|off|off" minimum_number_of_headings="6" scroll_speed="8500ms" level_markers_1="decimal" level_markers_3="none" title_container_bg_color="#004274" _builder_version="4.22.2" _module_preset="default"...
    Top Benefits of Data Governance for Your Organization
    Top Benefits of Data Governance for Your Organization

    [pac_divi_table_of_contents included_headings="on|on|on|off|off|off" minimum_number_of_headings="6" scroll_speed="8500ms" level_markers_1="decimal" level_markers_3="none" title_container_bg_color="#004274" admin_label="Table Of Contents Maker"...

    What is Ad Hoc Analysis and Reporting?

    What is Ad Hoc Analysis and Reporting?

    We might face or hear such dialogues regularly in our work environment, today’s fast-paced business environment demands quick access and data analysing capabilities as a core business function. Standard transactions systems; standard ERP, CRM & Custom applications designed for specific business tasks do not have capabilities to analyse data on the fly to answer specific situational business questions.

    Self-service BI tools can solve this need provided, it is a robust Data Warehouse composed of prower-full ETL from various data sources.  

    Here is the brief conversation, have a look:

    Data Governance components

    Senior Management: “Good morning, team. We have a meeting tomorrow evening with our leading customer, we urgently need some key numbers for their sales, Credit utilised, their top products and our profits on those products, and their payment patterns for this particular customer. These figures are crucial for our discussions, and we can’t afford any delays or inaccuracies. Unfortunately, our ERP system doesn’t cover these specific details in the standard dashboard.”

    IT Team Lead: “Good morning. We understand the urgency, but without self-service BI tools, we’ll need time to extract, compile, and validate the data manually. Our current setup isn’t optimised for ad-hoc reporting, which adds to the challenge.”

    Senior Management: “I understand the constraints, but we can’t afford another incident like last quarter. We made a decision based on incomplete data, and it cost us significantly. The board is already concerned about our data management capabilities.”

    IT Team Member: “That’s noted. We’ll need at least 24 hours to gather and verify the data to ensure its accuracy. We’ll prioritise this task, but given our current resources, this is the best we can do.”

    Senior Management: “We appreciate your efforts, but we need to avoid any future lapses. Let’s discuss a long-term solution post-meeting. For now, do whatever it takes to get these numbers ready before the board convenes. The credibility of our decisions depends on it.”

    IT Team Lead: “Understood. We’ll start immediately and keep you updated on our progress. Expect regular updates as we compile the data.”

    Senior Management: “Thank you. Let’s ensure we present accurate and comprehensive data to the board. Our decisions must be data-driven and error-free.”

    Data Governance components

    Unlocking the Power of Self-Service BI for Ad Hoc Analysis

    What is Ad-Hoc Analysis?

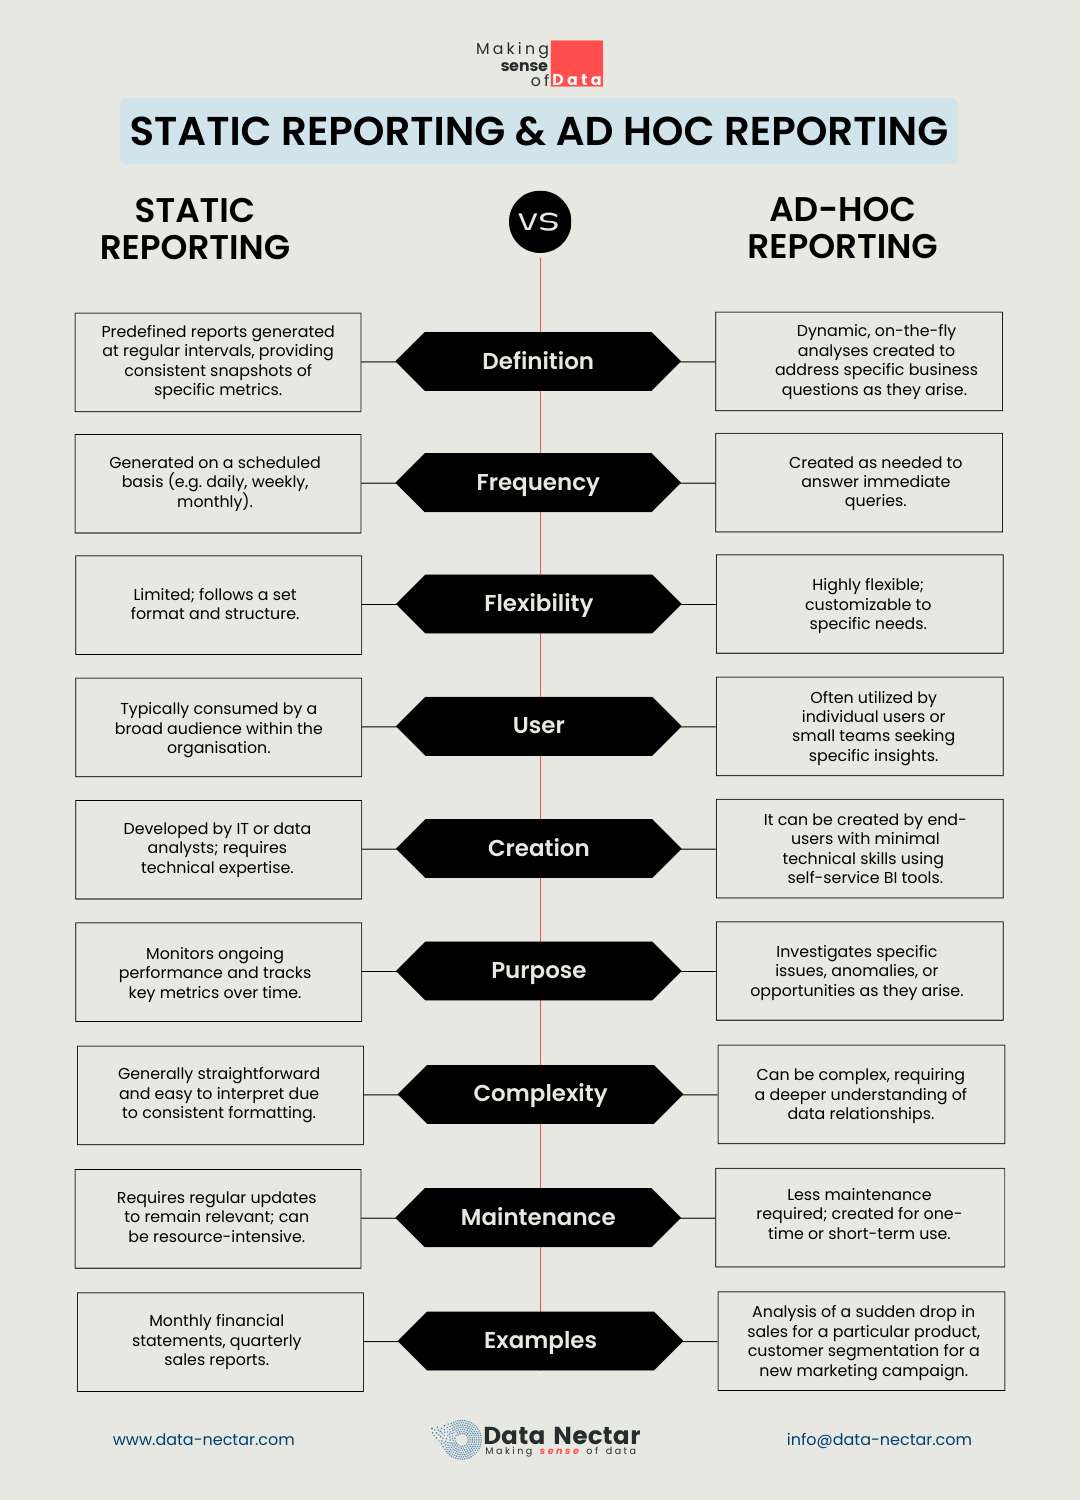
    Process to create, modify and analyse data spontaneously to answer specific business questions is called Ad-Hoc Analysis also referred as Ad-Hoc reporting. Here to read carefully is “SPONTANEOUSLY”, e.g. as and when required, also may be from multiple sources.
    In comparison to standard reports of ERP, CRM or other transactional system, those are predefined and static, Ad-Hoc analysis is dynamic and flexible and can be analyses on the fly.

    Why is Ad-Hoc Analysis important to your business?

    Data grows exponentially over the periods, Data Sources are also grown, Impromptu need of specific business questions can not be answered from a single data set, we may need to analyse data that are generated at different transactional systems, where in Ad-Hoc reporting or analysis is best fit option.

    So, For the following reasons Ah-Hoc Analysis is important in the present business environment.

    1. Speed and Agility: 

    Users can generate reports or insights in real time without waiting for IT or data specialists. This flexibility is crucial for making timely decisions and enables agile decision making.

    2. Customization: 

    Every other day may bring unique needs, and standard reports may not cover all the required data points. Consider Ad-hoc analysis: every analysis is customised for  their queries and reports to meet specific needs.

    3. Improved Decision-Making: 

    Access to spontaneous data and the ability to analyse it from different angles lead to better-informed decisions. This reduces the risk of errors and enhances strategic planning.

    You might not need full time Data Engineer, we have flexible engagement model to meet your needs which impact on ROI

    Implementing Self-Service BI for Ad Hoc Analysis

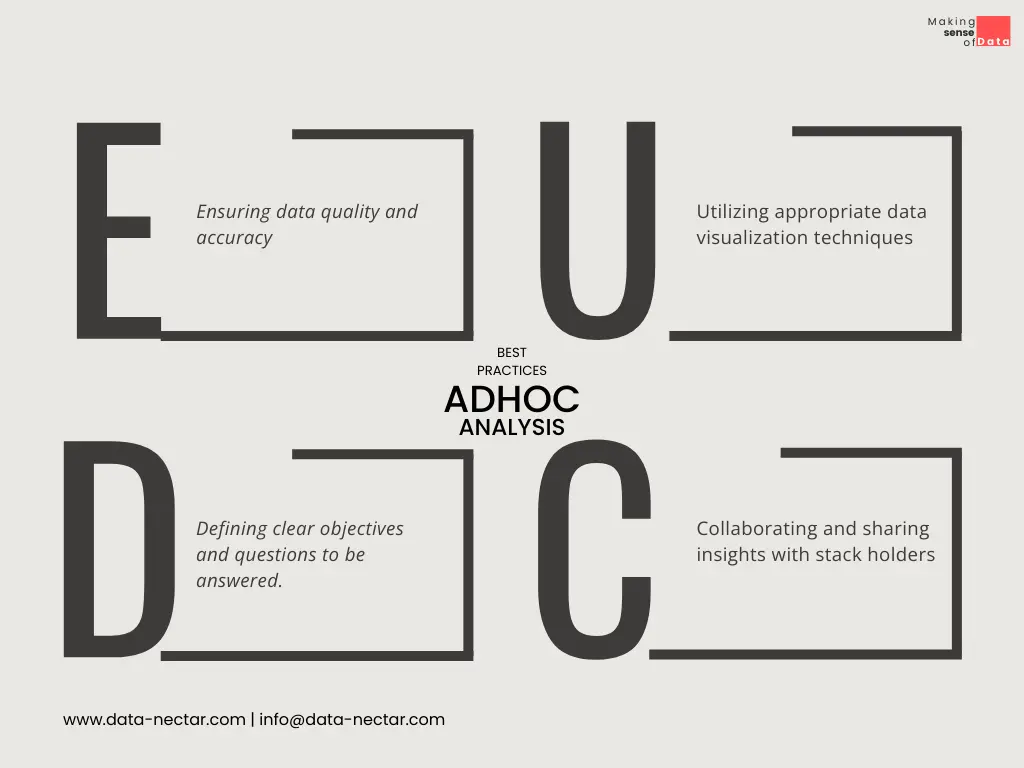
    Self-service BI tools empower non-technical users to perform data analysis independently.

    What does your organisation need?

    Curreated data from different sources to single cloud base data warehouse

    With direct connections to a robust data warehouse, self-service BI provides up-to-date information, ensuring that your analysis is always based on the latest data.

    Self Service BI tool which can visualise data. – Modern self-service BI tools feature intuitive interfaces that allow users to drag and drop data fields, create visualisations, and build reports without coding knowledge.

    Proper training to actual consumers or utilizer of data for timely decision(they should not be waiting for the IT team to respond until their need requires highly technical support. Modern self-service BI tools feature intuitive interfaces that allow users to drag and drop data fields, create visualisations, and build reports without coding knowledge.

    Data Governance components

    What will be impact one your organisation is ready with Self Service BI tools

    Collaboration and Sharing: 

    Users can easily share their reports and insights with colleagues, fostering a culture of data-driven decision-making across the organisation.

    Reduced IT Dependency: 

    By enabling users to handle their reporting needs, IT departments can focus on more strategic initiatives, enhancing overall efficiency.

    Self Service Tools for Ad-Hoc Analysis

    • Microsoft Excel
    • Google Sheets
    • Power BI
    • Tableau
    • Qlick

    Read more about Getting Started with Power BI: Introduction and Key Features

    How Data Nectar Can Help?

    Data Nectar team have helped numerous organizations to implement end to end Self Service BI tools like Power BI, Tableau, Qlik, Google Data Studio or other, that includes Developing robust cloud or on premise data warehouse to be used at self service BI tools. Training on leading BI tools. Accelerate ongoing BI projects. Hire dedicated; full time or part time BI developer, migration from standard reporting practice to advance BI practice. 

    Final Wrapping, 

    Incorporating self-service BI tools for ad hoc analysis is a game-changer for any organisation. It bridges the gap between data availability and decision-making, ensuring that critical business questions are answered swiftly and accurately. By investing in self-service BI, companies can unlock the full potential of their data, driving growth and success in today’s competitive landscape.

    Hire our qualified trainers who can train your non IT staff to use self service Business Intelligence tools.

    Recent Post

    What is Ad Hoc Analysis and Reporting?
    What is Ad Hoc Analysis and Reporting?

    [pac_divi_table_of_contents included_headings="on|on|on|off|off|off" minimum_number_of_headings="6" scroll_speed="8500ms" level_markers_1="decimal" level_markers_3="none" title_container_bg_color="#004274" _builder_version="4.22.2" _module_preset="default"...

    Top Benefits of Data Governance for Your Organization
    Top Benefits of Data Governance for Your Organization

    [pac_divi_table_of_contents included_headings="on|on|on|off|off|off" minimum_number_of_headings="6" scroll_speed="8500ms" level_markers_1="decimal" level_markers_3="none" title_container_bg_color="#004274" admin_label="Table Of Contents Maker"...

    How to Build a Scalable Data Analytics Pipeline

    How to Build a Scalable Data Analytics Pipeline

    In today’s data-driven world, the ability to harness and analyze data efficiently is paramount. That’s where a scalable data analytics pipeline comes into play. This essential framework empowers organizations to process and analyze data systematically and efficiently. Join us on a journey as we delve into the core concepts, techniques, and best practices behind building and implementing a scalable data analytics pipeline. Unlock the potential of your data, streamline your workflows, and make data-driven decisions with confidence. Welcome to the world of scalable data analytics – a game-changer for data enthusiasts and businesses alike.

    There is no denying that data is the most valuable asset for a corporation. But making sense of data, developing insights, and translating them into actions is even more critical.

    The average business analyzes only 37-40% of its data. Big data applications can rapidly analyze massive amounts of data, producing representations of current business insights, offering actionable steps in the data pipeline to improve operations, and forecasting future consequences.

    What Is A Data Analysis Pipeline?

    The data analysis pipeline is a way of collecting raw data from numerous data sources and then transferring it to a data store for evaluation, such as a lake of data or data warehouse.

    Before data flows into a data repository, it is often processed. It is especially significant when the dataset’s final destination is a relational database. For building scalable data pipelines, the steps are as follows,

    1. Data collection

    The first and most important part of the data analysis pipeline is data collection, where you must determine your data source.

    • Are they from a different data source or top-level applications?
    • Is the data going to be structured or unstructured?
    • Do you need to clear up your data?

    We may think of big data as a chaotic mass of data, but usually, big data is structured. More strategies will be required to establish a data pipeline on unstructured data.

    The architecture of your pipeline may vary depending on whether you acquire data in batch or through a streaming service.

    A batch-processing pipeline necessitates a reliable I/O storage system, whereas a streaming-processing pipeline needs a fault-tolerant transmission protocol.

    If it comes to structured data, whether it’s text, numbers, or images, they need to go via a process called data serialization before they can be fed into the pipeline.

    It is a method of transforming structured data into a form that enables the exchange or storage of the data in a way that allows for the recovery of its original structure.

    2. Data storage and management

    Assume the data-collecting modules are functioning; where will you store all the data? Many factors influence this, including hardware resources, data management competence, maintenance budget, etc. As this is a long-term investment, you must decide before determining where to invest your money.

    The Hadoop File System has long been the top choice within the company’s data infrastructure. It provides a tightly connected ecosystem that includes all tools and platforms for data storage and management.

    A viable Hadoop stack can be put up with minimal effort. Its strength rests in its ability to scale horizontally, which means grouping commodity gear side by side to improve performance while minimizing costs.

    You may even go above and beyond by optimizing the storage format. Storing files in.txt or.csv format may not be the best option in HDFS. Apache Parquet is a columnar format available to each Hadoop project and should be utilized by every data engineer.

    3. Analytics engines

    The Hadoop ecosystem and its equivalents are suitable for large data storage systems but not for use as an analytics engine. They are not designed to run quick queries. We run ad hoc queries constantly for analytics purposes.

    Thus we need a solution that returns data quickly. Subordinate storage must be constructed on top of an analytics engine.

    Vertica is a database management system built for large-scale analytics and rapid query performance. It keeps information in a columnar format and uses projections to spread data across nodes for fast queries.

    Because of its track record for offering a robust analytics engine and an efficient querying system, Vertica is frequently employed by many tech organizations.

    Vertica can serve as a database for various data-related external applications due to its easy connection with Java, Scala, Python, and C++.

    However, there are significant drawbacks to dealing with real-time data or high-latency analytics in Vertica. Its limitations on altering schemas or adjusting projections limit its application to data that requires rapid change.

    Druid is a free software analytics database created primarily for Online Analytics Processing (OLAP). Time-series data needs an optimal storage system as well as quick aggregators.

    4. Monitoring and Quality

    After you have completed data collection, storage, and visualization integration, you may wish to plug and play. But we also need to consider,

    • What to do in the event of an incident?
    • Where do you turn when your pipeline fails for no apparent reason?

    That is the goal of the entire monitoring procedure. It allows you to track, log, and monitor the health and performance of your system. Some technologies even enable live debugging.

    That being said, a proper monitoring system is required to establish a long-lasting data pipeline. There are two types of monitoring in this context: IT monitoring and data monitoring.

    Data monitoring is just as important as the other components of your big data analytics pipeline. It identifies data issues such as latency, missing data, and inconsistent datasets.

    The integrity of data traveling within your system is reflected in the quality of your data analysis pipeline. These measurements ensure that data is transferred from one location to another with minimal or no data loss without influencing business consequences.

    We cannot list all of the metrics reported by data monitoring tools since each data pipeline has unique requirements requiring unique tracking.

    Focus on latency-sensitive metrics when developing a time-series data pipeline. If your data arrives in bunches, correctly track its transmission processes.

    How to Create a Scalable Data Analysis Pipeline

    Creating scalable data pipelines, like addressing accessibility issues, requires time and effort, to begin with. Still, when the group grows, it will be worth it. Here are the actions you take to make sure that your data pipelines are scalable:

    Select The Correct Architecture

    Choose a flexible architecture that meets the data processing requirements of your firm.

    A scalable architecture can handle rising volumes of data or processing needs without requiring major adjustments or generating performance concerns.

    It can include implementing distributed networks that allow for horizontal growth by adding nodes as needed or cloud-based solutions that offer scalable infrastructure on demand.

    The architecture should also be responsive to modifications in sources of data or processing requirements over time.

    1. Implement Data Management

    Create a data management strategy according to your organization’s specific objectives and goals, the data kinds and sources you’ll be dealing with, and the different kinds of analysis or processing you’ll perform on that data.

    For example, a typical data warehousing solution may be appropriate if you have a large volume of structured data that must be processed for business intelligence purposes.

    On the other hand, a data lake strategy may be more appropriate when dealing with unstructured data, such as social media feeds or sensor data.

    A data lake enables you to store vast amounts of data in their native format, making it easier to handle and interpret data of diverse quality and type.

    2. Use Of Parallel Processing

    Employ parallel processing techniques to boost the processing capacity of your data pipeline. It breaks a task into several smaller tasks that can be completed simultaneously.

    Suppose a data pipeline is created to process a significant amount of data. Then you may need to divide the data into smaller portions so that different computers may handle it in parallel.

    3. Optimize Data Processing

    Limiting data transport, employing caching and in-memory processing, compressing data, and conducting incremental updates rather than re-computing past data are all ways to optimize data processing.

    A scalable pipeline will process enormous amounts of data in real-time while also adjusting to future needs and demands.

    As a result, the data team’s efficiency, adaptability, and ability to empower business users to make informed data-driven decisions would improve.

    Common Data Analysis Pipeline Use Cases

    Data pipelines are now common in practically every sector and corporation. It could be as simple as moving data from one area to another or as complex as processing data for machine learning engines to make product suggestions.

    The following are some of the most typical data pipeline use cases:

    1. Utilizing Exploratory Data

    Data scientists utilize exploratory data analysis (EDA) to study and investigate data sets and describe their essential properties, frequently using data visualization approaches.

    It assists in determining how to modify data sources best to obtain the answers required, making it easier for data scientists to uncover patterns, detect anomalies, test hypotheses, and validate assumptions.

    2. Data Visualizations

    Data visualizations use standard images to represent data, such as graphs, plots, diagrams, and animations.

    3. Machine Learning

    Machine learning is a subfield of artificial intelligence (AI) and computer science that employs data and algorithms to replicate how humans acquire knowledge and gradually enhance its accuracy.

    Algorithms are trained to generate classifications or predictions using statistical approaches, revealing crucial insights in data mining initiatives.

    To read more here about machine learning benefits and its workflows

    How to Create an Accessible Data Science Pipeline

    Although the work required to create a usable data science pipeline may appear intimidating initially, it is critical to appreciate the considerable long-term advantages they may have.

    A well-designed and easily available data pipeline helps data teams to acquire, process, and analyze data more rapidly and consistently, improving their medium- to long-term workflow and allowing informed decision-making.

    The following are the steps in a data pipeline to creating an accessible data pipeline:

    1. Define your data requirements.

    Determine how data will move through the pipeline by identifying the information about your company’s sources, types, and processing requirements.

    It ensures that data is maintained and routed logically and consistently.

    2. Implement standardization

    Establish name conventions, formatting, and storage standards for your data. It makes it easier for teams to identify and access data and decreases the possibility of errors or misunderstandings caused by discrepancies. Standardization can also make integrating more data sources into the pipeline easier.

    3. Select the correct technology.

    Select a unified data stack with an intuitive user interface and access control features.

    • Ensure that your team members can use your data tool regardless of data literacy level.
    • You can no longer rely on costly data engineers to build your data architecture.
    • Ensure that only the users who require the data have access to it.

    Automate processes

    Automating manual procedures in a data science pipeline can lead to more efficient and reliable data processing.

    For example, automating data intake, cleansing, and transformation operations can limit the possibility of human error while also saving time.

    Data validation, testing, and deployment are other procedures that can be automated to ensure the quality and dependability of the data pipeline.

    Process automation can also save data teams time to focus on more complicated duties, such as data analysis and modeling, resulting in enhanced insights and decision-making.

    Wrapping Up

    Despite using many tools to allow distinct local activities, a Data Analytical Pipeline strategy assists businesses in managing data end-to-end and providing all stakeholders with rapid, actionable business insights.

    Recent Post

    What is Ad Hoc Analysis and Reporting?
    What is Ad Hoc Analysis and Reporting?

    [pac_divi_table_of_contents included_headings="on|on|on|off|off|off" minimum_number_of_headings="6" scroll_speed="8500ms" level_markers_1="decimal" level_markers_3="none" title_container_bg_color="#004274" _builder_version="4.22.2" _module_preset="default"...

    Top Benefits of Data Governance for Your Organization
    Top Benefits of Data Governance for Your Organization

    [pac_divi_table_of_contents included_headings="on|on|on|off|off|off" minimum_number_of_headings="6" scroll_speed="8500ms" level_markers_1="decimal" level_markers_3="none" title_container_bg_color="#004274" admin_label="Table Of Contents Maker"...

    Comparing the Top Cloud Service Providers: AWS vs. Azure vs. GCP

    Comparing the Top Cloud Service Providers: AWS vs. Azure vs. GCP

    Today’s businesses can’t function in the age of technology without resorting to cloud services.

    To store, process, and analyze huge quantities of data, launch applications, and rapidly expand their infrastructure, businesses are increasingly turning to the cloud.

    The most popular cloud computing providers are Amazon Web Services (AWS), Microsoft Azure (Azure), and Google Cloud Platform (GCP), in that order.

    These companies offer a wide range of services, each with its strong points and Cloud service features. Organizations that want to use the cloud to its entire potential need to know the differences between them.

    In this blog post, we’ll see the cloud computing comparison AWS, Azure, and GCP in-depth, looking at their main Cloud service features, strengths, and things to think about. 

    By the end, you’ll know how each company can suit your group’s demands, helping you decide.

    Let’s explore cloud computing comparison and see what makes AWS, Azure, and GCP so special as cloud service providers.

    Cloud computing comparison: AWS vs. Azure vs. GCP

    Amazon Web Services (AWS) is now the market leader across multiple infrastructure sectors. This includes services like scalable data storage, networking, servers, mobile app creation, and security. Its main competitor, Microsoft Azure, offers more efficient and scalable software options. 

    High-end big data analytics solutions are available on Google Cloud Platform GCP, and integration with products from other vendors is simple.

    With the increasing trend toward cloud-based systems due to their greater adaptability and scalability, certified cloud computing professionals are in high demand. Read on to see how these three factors might affect your IT career.

    What Is AWS (Amazon Web Services)?

    Amazon Web Services, commonly referred to generally as AWS, is Amazon.com’s all-inclusive and trendy cloud computing platform. 

    AWS (Amazon Web Services) is a cloud computing platform that offers a large range of different services and solutions that can be accessed by anybody in order to swiftly build and distribute a number of different applications and services.

    A wide variety of services, including application development and deployment, network infrastructure, data storage, database management, analytics, and security, are available through AWS. Some of these services include computing resources, data storage, and database management.

    These services were established with the adaptability to serve a wide variety of customers, from individual investors and small enterprises to major businesses and government organizations. They were designed with this adaptability in view.

    Who Uses AWS (Amazon Web Services)?

    • Netflix
    • Airbnb
    • Spotify
    • NASA
    • Samsung
    • BMW
    • Philips
    • Pfizer
    • Adobe
    • GE (General Electric)
    • Capital One
    • Unilever
    • Dow Jones
    • Lyft

    What is Azure (Microsoft Azure)?

    Azure (Microsoft Azure) is a cloud computing platform that offers several benefits to enterprises. Through Microsoft-managed data centers, businesses can create, deploy, and manage applications and services. 

    Azure (Microsoft Azure) organizations have flexible access to on-demand computing resources, storage space, database management, network connectivity, and more. 

    With Azure, organizations can experiment and expand without investing much in new or upgraded on-premises equipment because of the platform’s adaptability, stability, and security. 

    It is a flexible and well-liked option for cloud computing since it supports many different languages, frameworks, and tools.

    Who Uses Azure (Microsoft Azure)?

    • Citrix
    • FedEx
    • Pfizer
    • Verizon
    • LinkedIn
    • Accenture
    • Siemens
    • Johnson & Johnson
    • Airbus
    • Allscripts

    What is GCP (Google Cloud Platform)?

    Cloud computing services offered by Google are collectively known as Google Cloud or GCP (Google Cloud Platform). It provides multiple options for processing, storing, connecting, learning, analyzing, and more. 

    By utilizing Google’s worldwide infrastructure, businesses can create, launch, and expand their apps and services with Google Cloud. 

    GCP (Google Cloud Platform) offers dependable and adaptable cloud solutions that boost innovation, teamwork, and business transformation in businesses. 

    Google Cloud is well-known for its dedication to security and sustainability, as well as its cutting-edge data analytics tools and artificial intelligence and machine learning services. It’s a standard option for companies beginning on cloud-based digital transformation projects.

    Who Uses GCP (Google Cloud Platform)?

    • Spotify
    • Twitter
    • Snap Inc. (Snapchat)
    • PayPal
    • Etsy
    • Home Depot
    • Intuit
    • Best Buy
    • Target
    • Bloomberg
    • 20th Century Fox
    • Ubisoft
    • Colgate-Palmolive

    AWS vs. Azure vs. GCP: Cloud service features

    Feature

    AWS

    Azure

    GCP

    Market Share

    Largest market share

    Second-largest market share

    Third-largest market share

    Compute Services

    Elastic Compute Cloud (EC2), Lambda

    Virtual Machines (VMs), Azure Functions

    Compute Engine, Google Kubernetes Engine (GKE)

    Storage Services

    Simple Storage Service (S3), EBS

    Azure Blob Storage, Azure Files

    Cloud Storage, Persistent Disk

    Database Services

    Amazon RDS, DynamoDB

    Azure SQL Database, Cosmos DB

    Cloud SQL, Firestore, Bigtable

    AI/ML Services

    Amazon SageMaker, Rekognition

    Azure Machine Learning, Cognitive Services

    Google Cloud AI, AutoML

    Networking

    Amazon VPC, Elastic Load Balancer

    Azure Virtual Network, Load Balancer

    Virtual Private Cloud (VPC), Load Balancing

    Hybrid Capabilities

    AWS Outposts, AWS Snowball

    Azure Stack, Azure Arc

    Anthos


    Pricing: Amazon web services vs Google Cloud vs Azure 

    The IT industry generally agrees that Microsoft Azure offers the best value for its on-demand pricing, while Amazon falls somewhere in the middle. 

    Each of the three platforms gives all of its customer’s access to price plans that are competitive and additional cost-control capabilities, such as reserved instances, budgets, and resource optimization. The price of the cloud platform is determined by a number of different factors, including the following:

    • Needs of the Customer
    • Usage
    • The Services Provided

    Amazon web services

    AWS offers a pay-as-you-go pricing model, so you’ll only be billed for the resources you really use. It does not include any lengthy contracts or challenging licensing requirements in any way. 

    You may qualify for a discount proportional to the amount you use, allowing you to pay less for more use.

    Microsoft Azure

    In addition, Microsoft Azure offers affordable pay-as-you-go pricing that may be adjusted to the specific requirements of your company.

    Cancellation of the plans is possible, and continuous monitoring of cloud utilization and cost developments is required.

    Google Cloud

    Like other cloud service providers, Google Cloud only charges you for the resources you really utilize. It offers an easy and forward-thinking pricing strategy, which results in cost savings for you. 

    Hybrid and multi-cloud options

    The terms “hybrid” and “multi-cloud” describe methods and techniques that use both on-premises software and hardware with cloud-based resources and services from different suppliers.

    AWS hybrid and multi-cloud

    • Amazon ECS Anywhere
    • AWS Storage Gateway
    • AWS Snowball
    • AWS CloudEndure
    • AWS Outposts
    • AWS Local Zones
    • VMware Cloud on AWS
    • AWS Wavelength

    Azure hybrid And multi-cloud

    • Azure Arc
    • Azure Stack
    • Azure ExpressRoute
    • Azure Site Recovery
    • Azure Virtual WAN
    • Azure Advisor
    • Azure Policy
    • Azure Lighthouse
    • Azure API Management
    • Azure Logic Apps

    Google Cloud hybrid and multi-cloud

    • Anthos
    • Google Cloud VMware Engine
    • Cloud VPN
    • Cloud Interconnect
    • Cloud DNS
    • Cloud CDN
    • Cloud Identity-Aware Proxy

    Pros and Cons:

    Amazon Web Services

    Pros

    • Extensive service offerings and scalability
    • Rich ecosystem and broad community support
    • Largest market share in the cloud industry
    • Extensive global infrastructure

    Cons

    • The steeper learning curve for beginners
    • The pricing model can be complex
    • Less intuitive user interface

    Microsoft Azure

    Pros

    • Microsoft simplifies service migration.
    • Machine learning, AI, and analytics services at the forefront of their fields are only some of the many available alternatives.
    • Comparing prices to AWS and GCP, most services here are more affordable.
    • Hybrid cloud approaches have a lot of backers.

    Cons

    • Less variety of services offered than AWS.
    • Developed exclusively with corporate users in mind.

    Google Cloud

    Pros

    • Integrates smoothly with other Google tools.
    • Superior support for containerized workloads

    Con

    • Fewer features and less support for business applications than AWS and Azure

    Locations and levels of accessibility: Azure vs GCP vs Aws

    Consider the cloud provider’s supported regions as a first step in making a decision. Because of problems like latency and compliance rules, especially when it is working with data, cloud performance can be directly impacted by these factors.

    Following is a list of the Big Three:

    1. Amazon Web Service is distributed in 22 different areas of the world and 14 other data centers. There are over 114 edge sites, as well as 12 edge caches in regional areas.
    2. Each of Azure’s 54 regions contains three availability zones with 116 edge locations.
    3. The Google Cloud Platform is made up of more than 200 edge sites, 103 different zones, and 34 different cloud regions.

    Azure vs GCP vs Aws: Less focus on managed database services security

    Virtual Private Cloud (VPC) services for the great majority of AWS’s availability zones are provided by Fortinet. In addition, it employs Cognito for identity management, a key management service for secure information storage, and IAM technology for authentication. 

    Fortinet is another service used by Azure to provide maximum safety. Additionally, authentication is handled by Active Directory Premium, identity management is handled by Active Directory B2C, and data is encrypted using Storage Service Encryption on this cloud platform. 

    In the end, GCP uses FortiGate Next-Generation Firewall to provide top-notch security. Identity and Access Management (IAM) is used for authentication, AES256 central key management service for data encryption, and Cloud IAM/Cloud Identity-Aware proxy for authorization or authentication.

    Which cloud platform is better?
    Amazon web services vs Google Cloud vs Azure

    Each company has specific needs, and thus, service providers must tailor their offerings accordingly. 

    They must follow different rules and regulations. While many businesses offer the same services, cloud service companies generally find success by differentiating themselves in some way.

    One possible advantage is to know how AWS, Azure, and GCP fit into the wider cloud strategy goals of your company.

    Azure vs Gcp vs Aws developers: What’s their future?

    The US Bureau of Labor Statistics predicts a 22% increase in demand for software developers (Azure vs GCP vs aws developers) by 2030. Its expansion is expected to slow during a recession, but it will continue. 

    Coders and developers with experience will never be in short supply.

    You may increase your value to your current or prospective company by learning to code.

    Final Words

    It is important to consider your company’s unique requirements while making a final selection of top cloud providers. Regarding services, scalability, and global infrastructure, AWS, Azure, and GCP are the industry leaders in cloud computing. 

    To make a smart decision, weighing several aspects, such as service offers, pricing structures, support, and integration possibilities, is important.

    Ready to revolutionize your business with cutting-edge cloud solutions? Look no further than Data-Nectar. With a proven track record of delivering reliable and efficient cloud services, we offer a comprehensive range of solutions tailored to your specific needs. Whether you’re seeking advanced data analytics, seamless scalability, or robust security measures, our team of experts is here to empower your cloud strategy. Contact us now and elevate your business to new heights with us.

    Comparing the Top Cloud Service Providers

    Recent Post

    What is Ad Hoc Analysis and Reporting?
    What is Ad Hoc Analysis and Reporting?

    [pac_divi_table_of_contents included_headings="on|on|on|off|off|off" minimum_number_of_headings="6" scroll_speed="8500ms" level_markers_1="decimal" level_markers_3="none" title_container_bg_color="#004274" _builder_version="4.22.2" _module_preset="default"...

    Top Benefits of Data Governance for Your Organization
    Top Benefits of Data Governance for Your Organization

    [pac_divi_table_of_contents included_headings="on|on|on|off|off|off" minimum_number_of_headings="6" scroll_speed="8500ms" level_markers_1="decimal" level_markers_3="none" title_container_bg_color="#004274" admin_label="Table Of Contents Maker"...
    Why Migrate To The Modern Data Stack And Where To Start

    Why Migrate To The Modern Data Stack And Where To Start

    Businesses today collect huge quantities of data every day in our data-driven environment. 90% of the world’s data, according to IBM, has only been produced in the previous two years. 

    However, many businesses need help using outdated data stacks to manage and utilize this data effectively. 

    Recent research indicated that 75% of businesses claim that their present data infrastructure cannot handle the amount, velocity, and variety of data that will only increase. 

    Modern data stacks play a role in that. In this blog article, we’ll look at the advantages of switching to a modern data stack and offer advice on how to get started.

    What is Modern Data Stack?

    A modern data stack is a group of technologies that synchronize to help organizations get the most out of their data. 

    Data collection, storage, processing, and analysis are often done using various tools, platforms, and services.

    Modern data stacks are designed to be flexible, scalable, and agile so businesses can respond quickly and successfully to changing data needs. Cloud data warehousing options, integration tools, cloud-based data storage, and business intelligence systems are frequently included.

    One of the main benefits of a modern data stack is its capacity to provide businesses with a consistent, comprehensive picture of their data. They can then make better selections based on accurate, current information. 

    Also, it gives businesses the adaptability and agility they need to quickly adapt to changing customer demands and data sources.

    Key Advantages Of Modern Data Stack

    Businesses striving to gain value from their data might profit greatly from the modern data stack.

    • Scalability and Flexibility

    Modern data stacks are created to be scalable and versatile, enabling businesses to react quickly to shifting data transformation requirements. 

    A modern data stack may easily scale to meet demands as data quantities increase without requiring costly infrastructure upgrades.

    • Integration

    Businesses may connect to and integrate data from various sources thanks to the strong integration capabilities offered by a modern data stack. 

    Because of the unified perspective of data made possible by this, data administration is less complicated, and organizations are able to make better decisions based on detailed, timely insights.

    • Speed and Efficiency

    Businesses can process, analyze, and visualize data more rapidly and effectively with the help of a modern information stack. 

    It is especially crucial in today’s fast-paced corporate world, where choices must be taken immediately based on precise data insights.

    • Increased Data Quality

    Businesses can use a modern data stack to automate data cleansing and transformation processes and improve the quality of their data migration. 

    Thus, businesses may be able to make better decisions based on accurate, consistent, and reliable data.

    • Reduced Costs

    Businesses can save money by utilizing a modern data stack less frequently for manual data administration and analysis. 

    Also, cloud-based solutions may reduce the need for costly infrastructure because they are frequently more affordable and require fewer maintenance costs.

    • Competitive Benefit

    Businesses can gain a competitive edge by employing a modern data stack to extract insights and make data-driven choices faster and more precisely than competitors.

    Modern Data Stack Tool Examples

    Today’s market offers a wide range of modern data stack products, each created to address a particular area of data management, storage, processing, and analysis. Here are a few illustrations of modern data stack tools.

    • Cloud-based Data Storage

    Thanks to services like Amazon S3, Google Cloud Storage, and Microsoft Azure Blob Storage, businesses now have a flexible, scalable, and affordable option to store their data. 

    These solutions may be accessed and managed from any location and are built to handle huge amounts of data.

    • Data Integration

    Data from multiple places is connected to and integrated using Talend, Stitch, and Fivetran. 

    By automating the data transformation process, these systems decrease the complexity and time needed for human integration.

    • Data Warehousing

    Businesses can store and analyze data in one place using Snowflake, Amazon Redshift, and Google BigQuery

    These systems include quick, effective querying and are built to manage big amounts of data.

    • Business Intelligence

    Businesses can use Looker, Tableau, and Power BI to get robust analytics and visualization tools

    These technologies allow companies to easily and quickly analyze data, produce reports, and communicate insights to stakeholders.

    • Data Management

    Data management and governance are carried out within an enterprise using Collibra, Alation, and Informatica. 

    These tools guarantee data accuracy, consistency, and regulatory compliance.

    • Machine Learning (ML)

    Thanks to these platforms, businesses can build and deploy machine learning models using TensorFlow, PyTorch, and Microsoft Azure Machine Learning. 

    These tools are designed to handle huge amounts of data and allow businesses to gain insights and forecasts from their data.

    Who Can Utilize the Modern Data Stack?

    The current data stack can be used by any business that collects, manages, and analyzes data. 

    All sizes of enterprises, nonprofits, government agencies, and educational institutions fall under this category.

    The specific tools and solutions that comprise a modern data stack may vary depending on the size and sector of the organization. Still, modernizing the data stack’s fundamental ideas and advantages is relevant to a wide range of use cases.

    While larger organizations may need more robust and scalable solutions, smaller organizations may use lighter, more affordable tools. 

    Similarly, businesses in various sectors may need customized tools to handle and analyze data unique to that sector.

    Eventually, any organization wishing to manage and analyze data more efficiently, automate repetitive tasks, enhance collaboration and knowledge sharing, and gain a competitive advantage through data-driven decision-making can benefit from the modern data stack.

    How to Create a Modern Data Stack

    A modern data stack involves several processes requiring extensive planning and design. 

    Here are a few essential steps that must be taken when building a modern data stack.

    • Identify your Needs

    Determining your organization’s data requirements is the first step in building a modern data stack. To achieve this, you need to understand the many data types you must collect, store, and analyze and how to apply that data to create business insights and decisions.

    • Choosing Tools

    It requires researching and evaluating some options for data storage, integration, warehousing, business intelligence, and machine learning.

    • Design Architecture

    It would help if you choose how your data will flow through your stack and how your different technologies will work together to achieve your data goals.

    • Implement Stack

    To create a seamless data environment, you must configure and set up all of your various tools and solutions.

    • Test

    Verifying that your data is moving through your stack without any problems and that your tools and solutions are interacting as intended.

    • Improve and execute

    Assessing the effectiveness of your stack, identifying its weak points, and making the necessary adjustments to increase its functionality and effectiveness.

    Examples Of Modern Data Stacks In Various Industries

    Here are a few situations of modern data stacks used in different industries:

    • E-commerce

    Using tools like Snowflake for cloud data warehousing, Fivetran for data integration, Looker for data visualization and analysis, and Segment for customer data management, an e-commerce business may employ a modern data stack.

    • Healthcare

    A healthcare provider might employ a modern data stack that consists of technologies like Tableau for data visualization and analysis, Databricks for big data migration, and Google Cloud Healthcare API for secure data exchange.

    • Finance

    A financial institution might utilize a modern data stack that consists of applications like Kibana for data visualization and analysis, Apache Kafka for data streaming, and Amazon Redshift for cloud data warehousing.

    • Advertising

    A modern data stack that a marketing company might utilize comprises Airflow for workflow management, Google BigQuery for cloud data warehousing, and Data Studio for data visualization and analysis.

    • Gaming

    A gaming company might utilize a modern data stack that consists of Power BI for data visualization and analysis, AWS S3 for big data migration, and Apache Spark for big data migration.

    A Remark on the Transition from ETL Tools to ELT Tools

    The extraction, transformation, and loading of the ETL tools technique have historically been utilized to carry out data integration. 

    Data is retrieved from source systems, formatted for analysis, and then supplied into a data warehouse using this technique. 

    However, with the emergence of contemporary data stacks, there has been a shift toward applying the ELT (Extract, Load, Transform) strategy.

    Data is extracted from the source systems and then given into a data lake or warehouse in its raw form according to the ELT procedure. 

    After that, tools like SQL, Apache Spark, or Apache Hive convert the data into a data lake or warehouse. 

    Its strategy can be more effective and efficient since it enables businesses to store and analyze massive amounts of data at a reduced cost and without the need for costly loading processing.

    The ELT strategy also offers more adaptability, enabling firms to quickly alter and improve their data transformation procedures as their data demands change. 

    It can be particularly crucial in fields where data requirements are subject to quick change, like e-commerce or digital marketing.

    Although many industries still use the ETL tools method extensively, the move toward ELT is an important trend to watch in the modern data stack landscape.

    Final Words

    Organizations of all sizes and in all sectors can gain a great deal from transitioning to a modern data stack. It provides faster and more flexible data analysis, better data management, and greater team collaboration by utilizing cloud-based technology. 

    This blog has covered a lot of surroundings, from the tools needed to develop a modern data stack to the industries where it’s most frequently utilized. 

    We have looked at reasons for modernizing your data stack, the advantages of doing so, and the distinctions between modern and legacy data stacks. 

    Overall, the transition to modern data stacks offers enterprises an exciting chance to better utilize their data and generate economic value.

    Contact for Account Receivable Dashboards

    Recent Post

    What is Ad Hoc Analysis and Reporting?
    What is Ad Hoc Analysis and Reporting?

    [pac_divi_table_of_contents included_headings="on|on|on|off|off|off" minimum_number_of_headings="6" scroll_speed="8500ms" level_markers_1="decimal" level_markers_3="none" title_container_bg_color="#004274" _builder_version="4.22.2" _module_preset="default"...

    Top Benefits of Data Governance for Your Organization
    Top Benefits of Data Governance for Your Organization

    [pac_divi_table_of_contents included_headings="on|on|on|off|off|off" minimum_number_of_headings="6" scroll_speed="8500ms" level_markers_1="decimal" level_markers_3="none" title_container_bg_color="#004274" admin_label="Table Of Contents Maker"...

      Contact Information

      Project Details