Why Data Is Not Enough: The Importance Of Analytics And Insights.

Why Data Is Not Enough: The Importance Of Analytics And Insights.

Analytics are now used by more than just large, big businesses. With 59% of companies employing analytics in some way, it is already widely used. And businesses are making use of this technology in a variety of ways.

What is the Difference Between Data, Analytics & Insights?

When we define the terms clearly, the variations become evident:

  • Data = a collection of facts.
  • Analytics = organizing and examining data.
  • Insights = discovering patterns in data. 

The Real Potential of Insight-Driven Advertising

Their actual worth lies in the power of data and analytics to produce in-depth insights. Many data points are possible.

But you need to be able to process and arrange that data to derive insightful information from it.

These mobile insights are aided by predictive app marketing, which gives apps rapid insight by identifying which customers are most likely to quit or convert in the future based on the app’s very own data. 

Following that, brands can use these prescient data to boost conversions and proactively stop defection.

What Is Data?

Data are the details you learn about users, such as their demographics, behaviors, and activities.

More data than ever before are now available to us. More data has been produced recently than at any other time in human history, and this trend is expected to continue.

Data gathering and storage have gone way up as many methods exist to connect to and use the internet. 

Big data has become the new standard as organizations gather consumer data through numerous channels, such as apps, email, and online browsing.

Despite the massive quantity of data, it isn’t easy to interpret without cleaning and deduplicating it.

What is Analytics?

Analytics is the process of identifying patterns and trends in your data.

Analytics are essential for data to be helpful. Analytics is making sense of your data and identifying significant trends. 

These vast data sets contain immense importance that applications and other businesses can only access with analytics.

Your data may show that you have some numbers. 

The information isn’t beneficial, but an analytics tool might dig deeper into it. This converts your data and offers you the first idea of how successful your mobile app marketing is.

What are Analytical Insights?

The benefit derived from the usage of analytics is insight. Analytical insights are practical and can be used to expand your brand while detecting potential markets.

Insights may reveal that increase in purchases if we stick with the same example. 

Now that you know how successful your push campaigns are, you can keep testing new ideas and improving your messaging to increase sales even more.

Examples Of Data Insights

Several sectors and organizational departments will have different data insights. Yet, the four essential data insight examples that are provided below can be used by various teams.

Data Insights which:

  • Improve processes to boost output.
  • Find new markets for your goods and services to generate new revenue sources.
  • To lessen the loss, better balance risk and return.
  • Increase customer knowledge to boost lifetime value and loyalty.

Advantages Of Data Analytics Insights

An Organisation Can Make Better Judgements With Data Analytics Solutions. 

Organizational decisions are frequently based more on instinct than on facts and figures. One reason for this can be a lack of access to high-quality data that would help in decision-making.

Analytics may assist in converting the available data into useful information for executives to make better decisions. 

Fewer bad decisions could be a source of competitive advantage since bad choices can harm several things, including corporate growth and profitability.

Boost The Effectiveness Of The Work

Analytics may assist in quickly analyzing vast quantities of information and displaying it in a structured fashion to help achieve specific organizational goals. 

By enabling the management to communicate the insights from the analytics results with the staff, it promotes an environment of efficiency and cooperation. 

A company’s weaknesses and potential areas for improvement become apparent, and steps can be taken to improve workplace efficiency and boost productivity.

The Analytics Keeps You Informed Of Any Changes In Your Customers’ Behaviour.

There are many options for clients. If businesses are not responsive to the wants and needs of their customers, they may quickly slide into a problem. 

In this age of digitization, customers frequently encounter new information, which causes them to change their thoughts. 

With the help of analytics, it is almost possible for enterprises to understand all the changes in consumer perception data, given a large amount of customer data. 

Analytics can help you understand your target market’s mentality and whether it has changed. 

Consequently, being aware of the shift in client behavior can provide a significant edge to organizations so that they can react faster to market developments.

Products And Services Are Customised

The days when a business could provide customers with uniform goods and services are gone forever. Consumers want goods and services that can suit their specific requirements. 

Analytics may help companies track the kind of product, service, or content that customers prefer and then make recommendations based on those preferences.

For instance, we typically see what we want to see on social media, thanks to the data collecting and analytics performed by businesses. 

Data analytics services allow customers to receive customized services based on their unique needs.

Enhancing The Quality Of Goods And Services

By identifying and fixing faults or preventing non-value-added tasks, data analytics solutions can aid in improving the user experience. 

Self-learning systems, for instance, can make the required adjustments to improve the user experience by using data to understand how users interact with tools.

Data analytics services can also aid in automatic data cleansing, enhance data quality, and ultimately benefit customers and enterprises.

Limitations Of Data Analytics Insights

  • Lack of alignment within teams
  • Lack of commitment and patience
  • Low quality of data
  • Privacy concerns
  • Complexity & Bias

How to Get Data Insights?

Determining objectives, gathering, integrating, and maintaining the data, analyzing the data to derive insights, and finally distributing these insights are typical steps in obtaining actionable data insights.

Establish business goals

Stakeholders start the process by outlining specific goals, such as enhancing production procedures or identifying the most successful marketing campaigns.

Gathering of data

Ideally, methods for gathering and storing raw source modern data stack already exist. If not, the company must set up a systematic data collection strategy.

Data management and integration

Data integration is required to clean up source data so that it is analytics-ready after it has been gathered. 

This method combines data replication, ingestion, and transformation to integrate various forms of data into standardized formats that can be kept in a repository like a data lake or data warehouse.

Data analysis

Users of data exploration software or business intelligence (BI) tools can collaborate to create data insights that address specific queries. 

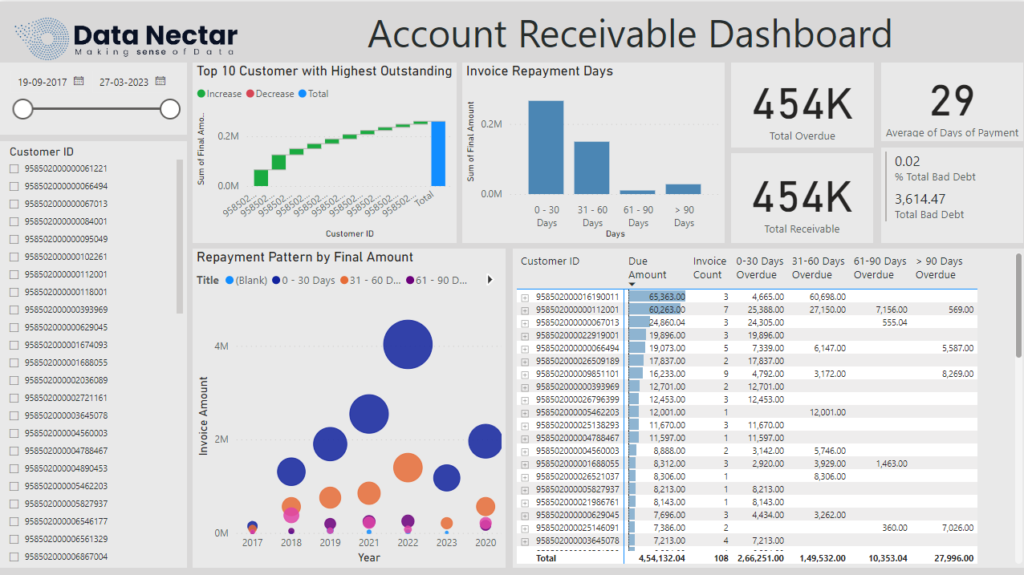
Afterward, users can use dashboards and reports to discuss their results. 

Self-service analytics, which allows any user to evaluate data without writing code, is a feature of some contemporary technologies. 

Because of this functionality, more users can collaborate with and gain insights from their data.

Key Features Of Modern Analysis Technologies That Produce Deeper Data Insights

Dashboards And Information Visualisation

People better understand and cooperate with data on interactive digital dashboards.

Improved Analytics

Artificial intelligence and machine learning improve your intuition by recommending analyses and insights for you to conduct.

Embedded Analytics

If analytical capabilities are built into the apps and workflows people frequently use, they will discover actionable data insights more quickly.


Choose The Right Tools

One of a company’s most precious assets, data can significantly impact its long-term performance.

Because of this, it’s crucial to use the appropriate technologies and tools to properly utilize all accessible data and make it as precise as possible.

These are some particular criteria we consider when evaluating tools and technology for precise data analysis:

  • Normalizing data for the straightforward arrangement
  • Shareable dashboards to facilitate team member communication
  • Complete mobility
  • Integration of third parties

While looking for tools, it’s a good idea to ask for a demo of any platform you’re considering to get a feel for how it operates, what the dashboard looks like, how user-friendly it is, and other factors.


Final Words

In a short time, analytics has advanced significantly. It can help with many different parts of operations and can change the game for many firms. 

But, to achieve the best outcomes, businesses must understand how to use this technology best, enhance the quality of their data, and efficiently manage it.

The Benefits of MLOps: Streamlining Machine Learning Workflow and Deployment

The Benefits of MLOps: Streamlining Machine Learning Workflow and Deployment

Putting machine learning models into production can be long and complex. There is a large margin for error between the experimental phase and the production floor, and the success of the deployment is contingent on several moving parts in the data, machine learning model, and code. The MLOps approach can help simplify this communication. While MLOps takes inspiration from DevOps, it also has its unique characteristics.

What is MLOps?

Machine learning operations (MLOps) is a strategy for overseeing all aspects of the machine learning model’s lifecycle, from development to regular use in production to eventual retirement.

Machine learning ops, or “DevOps for ML,” is an initiative to strengthen the relationship between the data scientists who create machine learning models and the operations groups who monitor the models’ use in production. 

It is accomplished through enhancing feedback loops and automating as many routine procedures as possible.

MLOps’ primary objective is to facilitate the application of AI technologies to business challenges, with a secondary focus on assuring that the results of any machine learning (ML) models adhere to ethical and reliable standards.

Let’s have a look at the critical components of the MLOps technique.

1. Version control

DevOps relies heavily on stable and up-to-date code versions. The data and models developed in MLOps must also be versioned. There must also be a correlation between the various versioning procedures. 

Each model requires its unique collection of data and version of the software. 

2. ML Pipelines

All the steps needed to create a model are part of the ML pipeline.

  • Preparing Input Data
  • Model development and evaluation
  • Providing feedback on the models’ performance (metrics, plots)
  • Model code continuous integration/continuous deployment registration and deployment

    Modifications to the code, the introduction of new data, or a predetermined timetable can all set off the ML pipeline. It is possible to create non-linear, complex workflows. 

3. Monitoring

As machine learning relies on recursive mathematical functions rather than hardcoded instructions, it is not uncommon for an ML model’s performance to degrade over time as new data is added. 

It is essential to keep an eye on this phenomenon, known as model drift, to ensure the model’s results stay within acceptable ranges.

4. Collaboration

Effective ML deployments necessitate a wide range of technical expertise and an organizational culture prioritizing teamwork across departments. 

Data scientists developing machine learning models and operations teams maintaining them in production can close the cultural and technological gaps through feedback loops.

5. Cloud computing environment

Training the model in the cloud creates a centralized, or at least shared, environment, which is excellent for teamwork among data scientists. 

Uniformity and repeatability, two factors essential to the timely completion of a machine learning project, are provided by a centralized setting and automated procedures.

For Data Nectar’s cloud-based code repository, we usually use a DevOps platform. Instead of keeping the trained model on our servers, we save it in a central registry just for models. The information can be held in the cloud and retrieved/mounted at the start of the training process. 

MLOps Deployment

An effective MLOps implementation can serve as a monitoring and automation system for ML models from their inception until retirement. 

Data scientists, programmers, compliance teams, data engineers, ML researchers, and company executives will all benefit from MLOps at its peak performance. 

There is a high failure rate with MLOps if it is not implemented correctly. Cultural issues, such as conflicting priorities and poor communication between departments, are a typical source of problems in organizations.

As a result, new feedback loops and technical features of a model’s lifecycle support services and tools are widely embraced.

What are the most effective MLOps practices?

Teams working on MLOps tools involve people from various parts of the business. 

Maintaining open lines of communication and adhering to best practices for each component of the pipeline can help data scientists, engineers, analysts, operations, and other stakeholders create and deploy ML models that consistently produce the best possible outcomes. Some examples are:

1. Data Preparation

One of the most crucial aspects of any ML model is the quality of the data. It is critical that the data used to train ML models is properly preprocessed. This entails the most effective methods for data cleansing, data exploration, and data transformation.

2. Engineered Features

Improving the precision of supervised learning results is a primary motivation for feature engineering. The process of data verification is an example of best practice. Making ensuring feature extraction scripts can be utilized again in production for retraining is also crucial.

3. Data Labeling

Superior label quality is essential for supervised learning. Best practices include having a clearly defined and reviewed labeling procedure that is accepted by experts in the field. 

4. Practice and Adjustment

Train and tweak simple, interpretable ML models first since they are simpler to debug. 

The debugging process for more sophisticated models can be simplified with the use of the following ML toolkits 

  • Google Cloud AutoML, 
  • MLflow, 
  • Scikit-Learn
  • Microsoft Azure ML Studio.

5. Auditing and Managing

Best practices for MLOps include version control, just as they do for DevOps. One way to check for modifications made to a model over its lifetime is to trace its ancestry. 

This best practice can be bolstered by utilizing cloud platforms like MLflow or Amazon SageMaker.

6. Monitoring

Monitoring the model’s outputs and summary data on a regular basis after deployment is an essential best practice. This entails keeping a watch on the following

  • Measures taken to check the load, utilization, storage, and health of the infrastructure on which the model runs are known as benchmarks.
  • Over- or under-representation in the incoming data might induce a bias that is summarized statistically. 
  • The core of the ML model. When a model’s outputs deviate outside of predetermined statistical thresholds, an automatic alert system can initiate the retraining process.

Advantages of MLOps

1. Lifecycle speed

Machine Learning ops (MLOps) is a defined procedure for developing reusable pipelines for machine learning. 

As opposed to the months-long process of unplanned coordination between the various specialist teams involved in a project, a machine learning model can proceed quickly from inspiration to deployment.

2. Convenient Reproduction system

Reproducing models is considerably simpler now because your code, data, and all previous versions of both are stored in the cloud. 

Data scientists can reliably recreate their models locally or in the cloud whenever they need to make adjustments.

3. Highly Collaborating

Machine learning tools development often calls for interdisciplinary groups to work together, with members having backgrounds in things like information technology, dev ops engineering, and data science. 

In the absence of a development framework that promotes teamwork, individuals tend to work in isolation, leading to inefficient delays that eat up resources. 

As part of the MLOps procedure, groups must work together to orchestrate their operations, shortening development timeframes and producing a product more suited to the business goal.

4. Standardization of data governance and regulatory compliance

There has been a tightening of rules and guidelines in the machine learning sector as the technology has matured.  

The General Data Protection Regulation (GDPR) of the European Union and the California Privacy Rights Act (CPRA) are two examples of regulations that could affect the use of machine learning. 

Machine learning models that are in line with applicable governmental and industry requirements can be replicated using the MLOps procedure.

5. Scalability

Using MLOps practices, which emphasize standardization, helps businesses swiftly increase the amount of machine learning pipelines they construct, manage, and monitor without significantly increasing their teams of data experts. 

Hence, MLOps allows ML projects to scale very well.

6. Components and models that can be reused

It is simple to adapt MLOps-built machine learning features and models to serve alternative organizational goals. 

The time it takes to deploy is cut even further by reusing pre-existing components and models, allowing for the rapid achievement of meaningful business goals.

Final Words

MLOps helps teams to bring their machine learning applications into a production setting much more quickly and with better outcomes. Teams can more easily adjust to new circumstances if they have a well-defined deployment strategy in place that links the staging and production environments. And since everything (data, models, and code) is versioned meticulously in the cloud, you never have to worry about losing any of your hard work.

While the controlled development process that MLOps provides may involve some growing pains for your team, we at Data-Nectar are firm believers in its merits. Do you need to get your team up to speed on MLOps? Please let us know how we can assist you.

Data Nectar analytics services
The Small Business Owner’s Guide To Data Analytics

The Small Business Owner’s Guide To Data Analytics

Dear small business owners,

I hope that the oncoming depressing sentence doesn’t end up upsetting you but if it does, please bear with me because I empathize with you and want to suggest something which will not only be useful but it may open up a new horizon for your profitability.

In comparison with the large businesses, our position is quite vulnerable in multiple aspects such as financial standing and cash flow, strategy, client reliance, being updated with the market, leadership dependence, balancing quality and growth, access to cutting-edge technology, customer retention, supply chain management, inventory control, handling price fluctuations, employees evaluation, sensing a customer going away, control on operations, etc to name a few. As small businesses, we do want to help our customers and offer them great deals but there are limitations on how generous we can be to them.

In such a scenario there is a tool if applied correctly, effectively, and smartly can give us a great help to smartly counter the challenges posed by the mighty large-size competitors. That tool is Data Analytics.

What exactly is Data Analytics?

Data Analytics is a buzzword nowadays, and it’s also branded as ‘the next big thing.’

Data analytics is a set of processes to collect data from various sources, transforming that data using well-defined algorithms, and organizing it in a way that it reflects meaningful conclusions to support informed decision-making and also to predict future trends and patterns.

Companies collect large amounts of data every moment from many types of data-feeding sources such as mobile phone sniffers, loyalty cards, financial transactions, point of sales, web page visits, online purchases, social media interactions, text input on any net-connected devices, and literally from every device we can and can not think of.

But that data as it is collected in large amounts (which is called raw data) doesn’t make any sense unless we have those exceptional superhuman abilities (thank God we don’t have that.)

Therefore we need ‘something’ which can synthesize and analyze the raw data and derives some meaningful and useful information out of that intimidating jumble. ‘Data Analytics’ is ‘something’ that can do that for us. 

It’s an art or science which can create a picture of meaningful information for us from scattered jigsaw pieces called raw data. 

Data Analytics is a process of analyzing raw data to help us extract useful ‘insights’ which are not only important but inevitable to make business decisions.

Why should small business owners use data Analytics?

If I want to describe it in the shortest way possible, It’s “if you want to figure out how to provide exactly the right product at the right time, exactly to the right customer, data analytics is the tool you must use.”

Data analysis allows you to conduct an objective assessment of your business.

You have to use Data Analytics to give your customers better service, reward them for their loyalty, to offer them a supportive product/service for the product they are going to buy. And also to predict if they’re going away from you.

You can also predict what’s happening in your customer’s life by looking at the data of their buying behavior (for example if a customer starts purchasing nappies and infant milk powder, there has been the arrival of a baby in their life. So you can help them get those things that are necessary for their parenthood.)

As owners of small businesses, it is crucial to understand what all that data means and what messages that data is conveying to us. Only then we can make informed decisions that can lead the business to healthy growth. 

Here are some of the things small business data analytics can tell you:

  • Where your business stands now 
  • Where your company goes if the trends remain the same 
  • The growth potential of your business 
  • How long it should take to expand your brand 
  • The steps to take to make the expansion happen

Note:

  1. The data must be analyzed daily, weekly, monthly, quarterly, and annually to get answers to all these questions.


  2. But one problem is the struggle to understand data. But we will see in the coming pages that it’s also not an issue provided you have a trusted pair of hands on which you can rely to take care of all the data-related operations. 

What are the benefits of Data analytics?

Data can point us in the right direction, and prevent us from getting in the wrong direction by showing us objective and unbiased facts.

  • For instance, by looking at the crowd in a giant supermall one can be tempted to get a place in the same supermall. But the reality can only be reflected when we look at the numbers of people visiting and people actually spending money there, and what is selling in what amount.

We can study the trends through various patterns in the data that help us in describing what happened, diagnose the exact issues, predict how the market will behave, and prescribe appropriate actions to deal with or take optimum advantage of the oncoming trends.

We can adapt data-directed thinking processes and decision-making.

If we want to understand our customers and figure out better and more profitable ways to help them, and also understand the behavior of our own organization to make it more operationally efficient, we certainly need to give data strategic importance.

We can logically devise strategies for expansion.

Other than these, there are a few more ways we can also apply Data Analytics to gain many other benefits. Some of them are as follows.

  1. It helps us reduce costs by shortening tasks, and in many cases eliminating them altogether.
  2. Organizational efficiency can be increased significantly by Increased operational efficiency.
  3. Data doesn’t lie. It helps us identify the exact weaknesses and failures.
  4. We can design new products and services based on Predictive Analysis and Prescriptive Analysis.
  5. Data can give us 360-degree customer reviews so we don’t have to rely on subjective spot surveys.
  6. Through thoroughly conducted Data Analytics it becomes easy to spot leakages which makes it easy to identify and prevent fraud.
  7. Data Analytics can also help us optimize pricing strategies.

In short, Data Analytics helps us make smarter logical business decisions.

Which BI Tools / Which technology tool should they select?

There are a number of BI tools to choose from, with different specialties. So it depends on your business needs and which functions of a BI tool you want to employ. Are your needs basic, or do they demand complex analysis? However, these are the basic criteria one should consider to select the best fit for one’s business.


  • Capabilities to collect data collection
  • Analytical abilities
  • Visualization facilities
  • Customizable reporting tools
  • Customizable dashboards
  • Predictive analytics
  • Integration ability with other tools
  • Security 

Here we are briefly explaining a few good BI tools. If you wonder which would be a better option for your business needs, please contact us for the best data analytics services and solutions. They will be happy to support you in choosing the right Data Analytics tool for you.

  1. Microsoft Power BI enables you to transform, explore, and analyze data on-premise and in the cloud. Also, it creates real-time visualizations and can connect relatively easily to your own data sources.


  2. Zoho Analytics has perhaps the most beautiful interactive dashboard. It supports multiple source data collection, and the data can be easily integrated through a simple interface and exports the results to various platforms and ecosystems.


  3. Scoro is good for its customizable KPI dashboard and real-time overview of every aspect of your work.


  4. Dundas BI is an end-to-end business intelligence platform with an open API across the entire platform. With drag-and-drop tools, it can quickly transform raw data into the form of dashboards, reports, and visual data analytics. Its ability to connect and integrate with other data sources is remarkable.


  5. Sisense can incorporate AI-enabled applications that can be embedded and integrated with a wide variety of sources and doesn’t require specialized training. It can get real-time data feeds to create intuitive dashboards and reports.


  6. MicroStrategy supports both data mining and visualization. It offers a multi-functional dashboard, big data solutions, and advanced analytics.


  7. Halo combines automated data processes with manual data manoeuvres for custom results. Its data integration, supply chain analytics, and visualization are automated and available in a single solution. For supply-chain management, this is most suited. Its intuitive interface allows multiple users to collaborate in real-time.


  8. Oracle has a large array of BI capabilities. It uses the Common Enterprise Model for calculations and business analytics and offers inbuilt tools for mining data, sending alerts, and data discovery which is rather agile. Its workspace is also easy to use and allows multi-user collaboration.


  9. SeekTable can perform ad-hoc analysis of all multiple sources of business data at once. It comes with facilities such as data restriction, live interactive reports, sorting, filtering, etc. It offers data analytics while allowing users access to reports.


  10. Tableau is a long-time tried and tested BI tool for live visual analytics. Its highly intuitive interface and drag-and-drop facility allow users to observe live trends. It features a mobile BI strategy and in-memory architecture for data visualization and exploration. It’s easy to integrate with Microsoft SharePoint and offers one-click reporting.


  11. GROW allows the extraction of data from over 115 sources, including Dropbox, Salesforce, Twitter, Google Analytics, etc. It features a highly intuitive UI with several data visualization elements. It also facilitates importing data from social media platforms such as Facebook, Twitter, LinkedIn, and more, helping optimize the marketing budget.


  12. Datapine facilitates and allows the visualization of many key metrics simultaneously. It’s an interactive BI tool featuring enabling versatile filters, mobile optimization, ad-hoc data source queries, fast and efficient connections to multiple data sources, predictive analytics, and data alarms based on customizable triggers. 

Other than these there are many more intelligent BI tools such as Syn Enterprise, BigID, Qualtrics Research Core, Active Batch, Salesforce Analytics Cloud, Board, CXAIR Platform, Looker, Reveal, Yellowfin, Periscope Data, AnswerDock, etc.

If you are looking for the best fit BI tool for your business, the best course of action is to talk to an expert at DataNectar who will understand your business, its processes, and your objectives and then figure out which one will be the best option.

Which types of skill sets do small business owners need for their organization?

To be very frank, you don’t need any skills to employ data analytics. This may come as a shock but think about it.

I’m sure you have heard this famous proverb “Do your best and delegate the rest.”

That’s the way forward to progress and growth. If you end up doing everything yourself, when will you think about expanding your business? To paraphrase Michael Gerber, if you end up working ‘in’ your business, when will you work ‘on’ your business?

Therefore the best answer I can give to this question is “Have a BI & Data Analytics partner like DataNectar on your side to take care of your BI needs.”

Having said that, let’s as well discuss what types of skills can be helpful to take optimum advantage of Data Analytics.

  • SQL (Structured Query Language) – It’s a programming language widely used for databases.
  • Oracle – It is a database commonly used for running online transaction processing, data warehousing, and mixed (OLTP & DW) database workloads.
  • R and Python – These are the most popular statistical programming languages used to create advanced data analysis programs
  • Machine Learning – an aspect of artificial intelligence that uses algorithms for pattern recognition in data
  • Statistical skills such as calculating probability to be able to analyze and interpret data trends
  • Data management – proficiency in collecting, organizing, and storing data
  • Data visualization – competence to visualize and illustrate data through graphic aids such as charts, graphs, and various figures
  • Econometrics – the skill to create mathematical models from the data trends that can predict future trends
  • Mathematical & statistical ability
  • Soft-skills:
    • Analytical mindset – An analyst must be able to analyze the data from multiple points of view to understand what’s happening and to dig deeper if necessary.
    • Problem-solving skills: Data analytics is all about answering questions and solving business challenges, and that requires some keen problem-solving skills. Data analysts have a wide variety of tools and techniques at their disposal, and a key part of the job is knowing when to use what. 
    • Communication skills: Once you’ve harvested your data for valuable insights, it’s important to share your findings in a way that benefits the business. Data analysts work in close collaboration with key business stakeholders and may be responsible for sharing and presenting their insights to the entire company. So, if you’re thinking about becoming a data analyst, it’s important to make sure that you’re comfortable with this aspect of the job.

What will be the role of a Data Analyst in your organization?

A data analyst collects all the scattered pieces of a large complex jigsaw data puzzle and creates a meaningful picture so that others can use that information. So if you choose to employ a full-time Data Analyst, his/her responsibilities will be like these.


  • To manage the delivery of user behavior surveys and create reports based on the results.
  • Work with clients to develop requirements, define success metrics, manage and execute analytical projects, and evaluate results.
  • Monitor practices, processes, and systems to identify opportunities for improvement.
  • Coming up with good questions and translating them into well-defined analytical tasks.
  • Gather new data to answer client questions, collating and organizing data from multiple sources.
  • Devise, build, test, and maintain back-end code.
  • Establish data processes, define data quality criteria, and implement data quality processes.
  • Work as part of a team to evaluate and analyze key data that will be used to shape future business strategies.

As a business leader, it must be an obvious matter for you to be aware of how crucial thing Data Analytics is. Also how vast a subject it is, and what level of complexities it involves. Therefore you must have employed a proper Data Analytics system and experts to run that system. 

However, the subject being a relatively recent phenomenon, it’s far from being practical that every organization would have its own team of Data Analytics experts.

Therefore it’s wise to have an external partner like us to direct and manage this matter.

We, at DataNectar, have a team of veterans who understand not only Data Science & Engineering but also the business processes in multiple industries thoroughly. They will be able to objectively study your business and come up with the parameters for analysis and also devise appropriate algorithms to extract information from the data.

We employ a system to extract the data from multiple data sources.

Clean the data up and store them in a defined order in a warehouse.

Take the data through a transformation procedure. And Create various visually understandable dashboards and analyses. 

By the way, we will choose the best tools for different steps in the entire BI exercise, and also set up automation wherever required.

After having done this exercise,

We sit with the team of the leaders of your business to support the brainstorming for interpreting the analysis.

We also support brainstorming for predicting the oncoming trends and Strategizing to take optimum advantage of those trends. 

At this stage, we’d like to offer you a free consultation for 15 minutes over the phone to understand your business issues. At the end of that conversation, either party can decide whether we are fit to work together or not. If we feel there is a synergy, we can set up a time for the next meeting, and if we don’t, we can still be friends. 

Feel free to contact us at info@data-nectar.com or visit our website at www.data-nectar.com

A look into Snowflake Data Types

A look into Snowflake Data Types

As a Database as a Service (DBaaS), Snowflake is a relational Cloud Data Warehouse that can be accessed online. This Data Warehouse can give your company more leeway to adapt to shifting market conditions and grow as needed. Its Cloud Storage is powerful enough to accommodate endless volumes of both structured and semi-structured data. As a result, information from numerous sources can be combined. In addition, the Snowflake Data Warehouse will prevent your company from needing to buy extra hardware.

Snowflake allows you to use the usual SQL data types in your columns, local variables, expressions, and parameters (with certain limitations). An identifier and data type will be assigned to each column in a table. The data type tells Snowflake how much space to set aside for a column’s storage and what form the data must take.

Snowflake’s great global success can be attributed to the following characteristics: 

    • Snowflake’s scalability stems from the fact that it provides storage facilities independent of its computation facilities. Data is stored in a database and processed in a virtual data warehouse. As a result, Snowflake guarantees excellent scalability at a low cost.
    • Snowflake requires little upkeep because it was made with the user in mind. It has a low barrier to entry and needs little in the way of upkeep.
    • Automated query optimization is supported in Snowflake, saving you time and effort over the hassle of improving queries manually.
    • Snowflake allows you to divide your company’s regular workloads into different virtual Data Warehouses. As a result, this facilitates Data Analytics management, particularly under extremely regular loads.

Six Important Snowflake Data Types

The first step in becoming a Snowflake Data Warehouse expert is learning the ins and outs of the different types of data it stores. There are 6 different kinds of data that can be used with Snowflake.

    1. Numeric Data Types
    2. String & Binary Data Types
    3. Logical Data Types
    4. Date & Time Data Types
    5. Semi-structured Data Types
    6. Geospatial Data Types

1) Numeric Data Types

Knowing what precision and scale are is crucial before diving into the various sorts of numeric data types. 

    • A number’s precision is the maximum number of significant digits that can be included in the number itself.
    • Scale is the maximum number of digits that can be displayed following a decimal point.

Precision has no effect on storage; for example, the same number in columns with different precisions, such as NUMBER(5,0) and NUMBER(25,0), will have the same storage requirements. However, the scale has an effect on storage; for example, the same data saved in a column of type NUMBER(20,5) requires more space than NUMBER(20,0). Additionally, processing bigger scale values may take a little more time and space in memory.

So here are a few types of numeric data types:

    • NUMBER is a data type for storing whole numbers. The default scale and precision settings are 0 and 38, respectively.
    • DECIMAL and NUMERIC are the same as NUMBER.
    • The prefixes INT, INTEGER, BIGINT, and SMALLINT all mean the same thing as NUMBER. But you can’t change the scale or precision; these serial data types are permanently stuck at 0 and 38.
    • Snowflake uses double-precision IEEE 754 floating-point values (FLOAT, FLOAT4, FLOAT8). 
    • FLOAT is a synonym for DOUBLE, DOUBLE PRECISION, and REAL.
    • Numeric Constants are numbers that have fixed values. It supports the following format:

2) String & Binary Data Types

The following character-related data types are supported in Snowflake:

    • With a maximum size of 16 MB, VARCHAR can store Unicode characters of any size. There are BI/ETL tools that can set the maximum allowed length of VARCHAR data before storing or retrieving it.
    • CHARACTER, CHAR is like  VARCHAR, but with the default length as VARCHAR(1).
    • If you’re familiar with VARCHAR, you’ll feel right at home with STRING.
    • Just like VARCHAR, TEXT can store any kind of character.
    • The BINARY data type does not understand Unicode characters; hence its size is always expressed in bytes rather than characters. There’s an upper limit of 8 MB.
    • To put it simply, VARBINARY is another name for BINARY.
    • String Constants are fixed values. When using Snowflake, string constants must always be separated by delimiter characters. Delimiting string literals in Snowflake can be done with either single quotes or dollar signs.

3) Logical Data Types

In logical data type, you can only use BOOLEAN with one of two values: TRUE or FALSE. Sometimes it will show up as NULL if the value is unknown. The BOOLEAN data type offers the necessary Ternary Logic functionality.

SQL requires using a ternary logic, often known as three-valued logic (3VL), which has three possible truth values (TRUE, FALSE, and UNKNOWN). To indicate the unknown value in Snowflake, NULL is used. The outcomes of logical operations like AND, OR, and NOT are affected by ternary logic when applied to the evaluation of Boolean expressions and predicates.

    • UNKNOWN values are interpreted as NULL when used in expressions (like a SELECT list).
    • Use of UNKNOWN as a predicate (in a WHERE clause, for example) always returns FALSE

4) Date & Time Data Types

This details the date/time and time data types that can be managed in Snowflake. It also explains the allowed formats for string constants to manipulate dates, times, and timestamps.

    • The DATE data type is supported in Snowflake (with no time elements). It supports the most typical dates format (YYYY-MM-DD, DD-MON-YYYY, etc.).
    • DATETIME is shorthand for TIMESTAMP NTZ.
    • A TIME data type represented as HH:MM: SS is supported by Snowflake. Additionally, a precision setting for fractional seconds is available. The default precision is 9. The valid range for All-TIME values is between 00:00:00 to 23:59:59.999999999. 
    • An alternative name for any of the TIMESTAMP_* functions is TIMESTAMP, which can be set by the user. The TIMESTAMP_* variant is used in place of TIMESTAMP whenever possible. This data type is not stored in tables.
    • Snowflake supports three different timestamp formats: TIMESTAMP LTZ, TIMESTAMP NTZ, and TIMESTAMP TZ.


      • The TIMESTAMP LTZ function accurately records UTC. The TIMEZONE session parameter determines the time zone in which each operation is executed.
      • TIMESTAMP NTZ accurately records wallclock time. Without regard to local time, all tasks are carried out.
      • By default, TIMESTAMP TZ stores UTC time plus the appropriate time zone offset. The session time zone offset will be utilized if the time zone is not specified.

5) Semi-Structured Data Types

Semi-structured data formats, such as JSON, Avro, ORC, Parquet, or XML, stand in for free-form data structures and are used to load and process data. To maximize performance and efficiency, Snowflake stores these in a compressed columnar binary representation internally.

    • VARIANT is a generic data type that can hold information of any other type, including OBJECT and ARRAY. Its 16 MB of storage space makes it perfect for archiving large files.
    • OBJECT comes in handy to save collections of key-value pairs, where the key is always a non-empty string and the value is always a VARIANT. Explicitly-typed objects are currently not supported in Snowflake.
    • Display both sparse and dense arrays of any size with ARRAY. The values are of the VARIANT type, and indices can be any positive integer up to 2^31-1. Arrays of a fixed size or containing values of a non-VARIANT type are not currently supported in Snowflake.

6) Geospatial Data Types

Snowflake has built-in support for geographic elements like points, lines, and polygons. The GEOGRAPHY data type, which Snowflake provides, treats Earth as though it were a perfect sphere. It is aligned with WGS 84 standards.

Degrees of longitude (from -180 to +180) and latitude (from -90 to +90) are used to locate points on Earth’s surface. As of right now, altitude is not a supported option.  More so, Snowflake provides GEOGRAPHY data-type-specific geographic functions.

Instead of retaining geographical data in their native formats in VARCHAR, VARIANT, or NUMBER columns, you should transform and save this data in GEOGRAPHY columns. The efficiency of geographical queries can be greatly enhanced if data is stored in GEOGRAPHY columns.

The following geospatial objects are compatible with the GEOGRAPHY data type:

    • Point
    • MultiPoint
    • MultiLineString
    • LineString
    • GeometryCollection
    • Polygon
    • MultiPolygon
    • Feature
    • FeatureCollection

Unsupported Data Types

If the above list of SQL server data types is clear, then what is the type of data that is incompatible with Snowflake? Here is your answer.

  • LOB (Large Object) 
    • BLOB: You can also utilize BINARY, with a maximum size of 8,388,608 bytes. 
    • CLOB: You can also use VARCHAR, with a maximum size of 16,777,216 bytes (for a single byte).
  • Other
    • ENUM
    • User-defined data types

Conclusion

While your primary focus should be on learning how to use customer data, you may be questioning why it’s necessary to know so many different data types. There is one motive for doing this, and that is to amass reliable information. Data collection and instrumentation aren’t the only areas where you can use your data type knowledge; you’ll also find that data administration, data integration, and developing internal applications are much less of a challenge now that you have a firm grasp on the topic.

Also, without a good database management system, it is impossible to deal with the massive amounts of data already in existence. Get in touch with our experts for more information.

    Contact Information

    Project Details